
Density is Key: 3D Transit Maps
The Atlanta and Chicago metro areas exhibit starkly different urban development patterns shaped by their distinct histories, geographies, and transportation networks. Chicago's density follows a classic radial model, with high-density urban cores (like the Loop and North Side neighborhoods) supported by robust transit and gradually decreasing in intensity toward the suburbs along commuter rail lines. In contrast, Atlanta's growth has been more decentralized, with moderate-density nodes (like Midtown and Buckhead) scattered across a sprawling, car-dependent landscape punctuated by low-density suburban development. While Chicago's development has been constrained by geographic barriers and long-established zoning, Atlanta's expansion has spread more freely along highway corridors, resulting in a larger metro footprint with lower overall density. The following maps and graphics aim to illustrate these extreme differences via 3D visualization, allowing for enhanced understanding.
The Atlanta Metro vs Chicagoland: How Density influences Transit
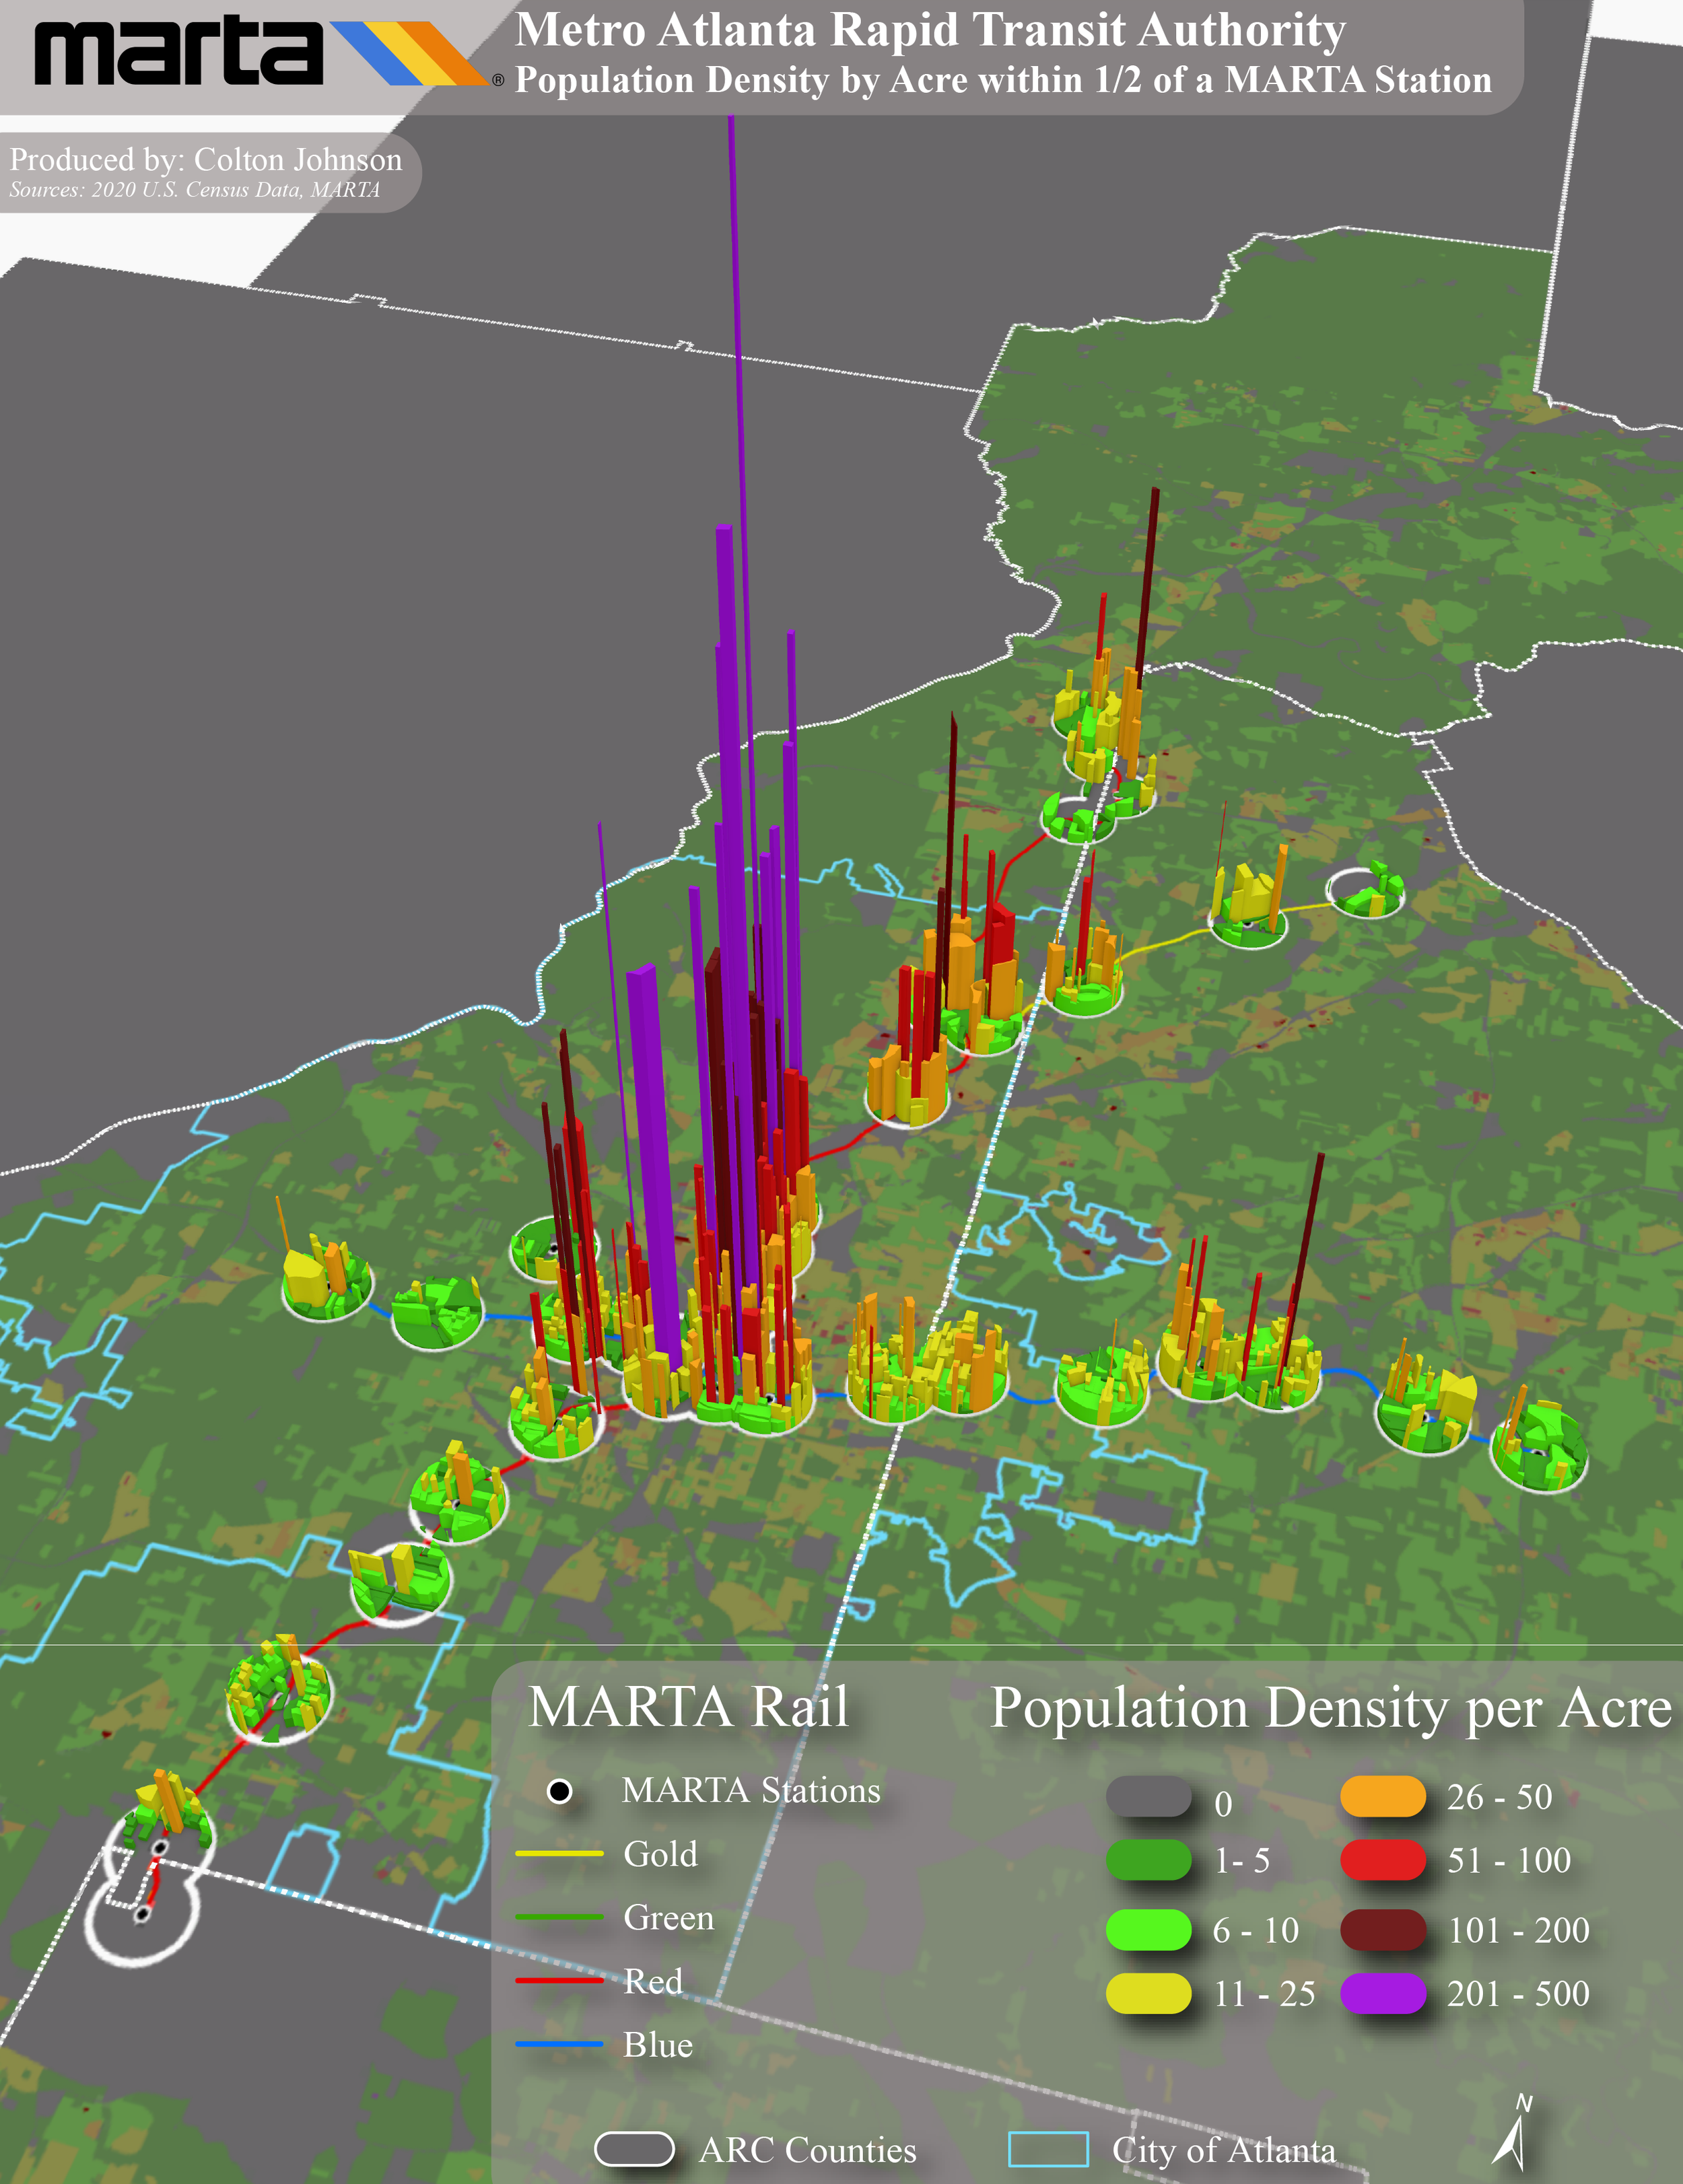
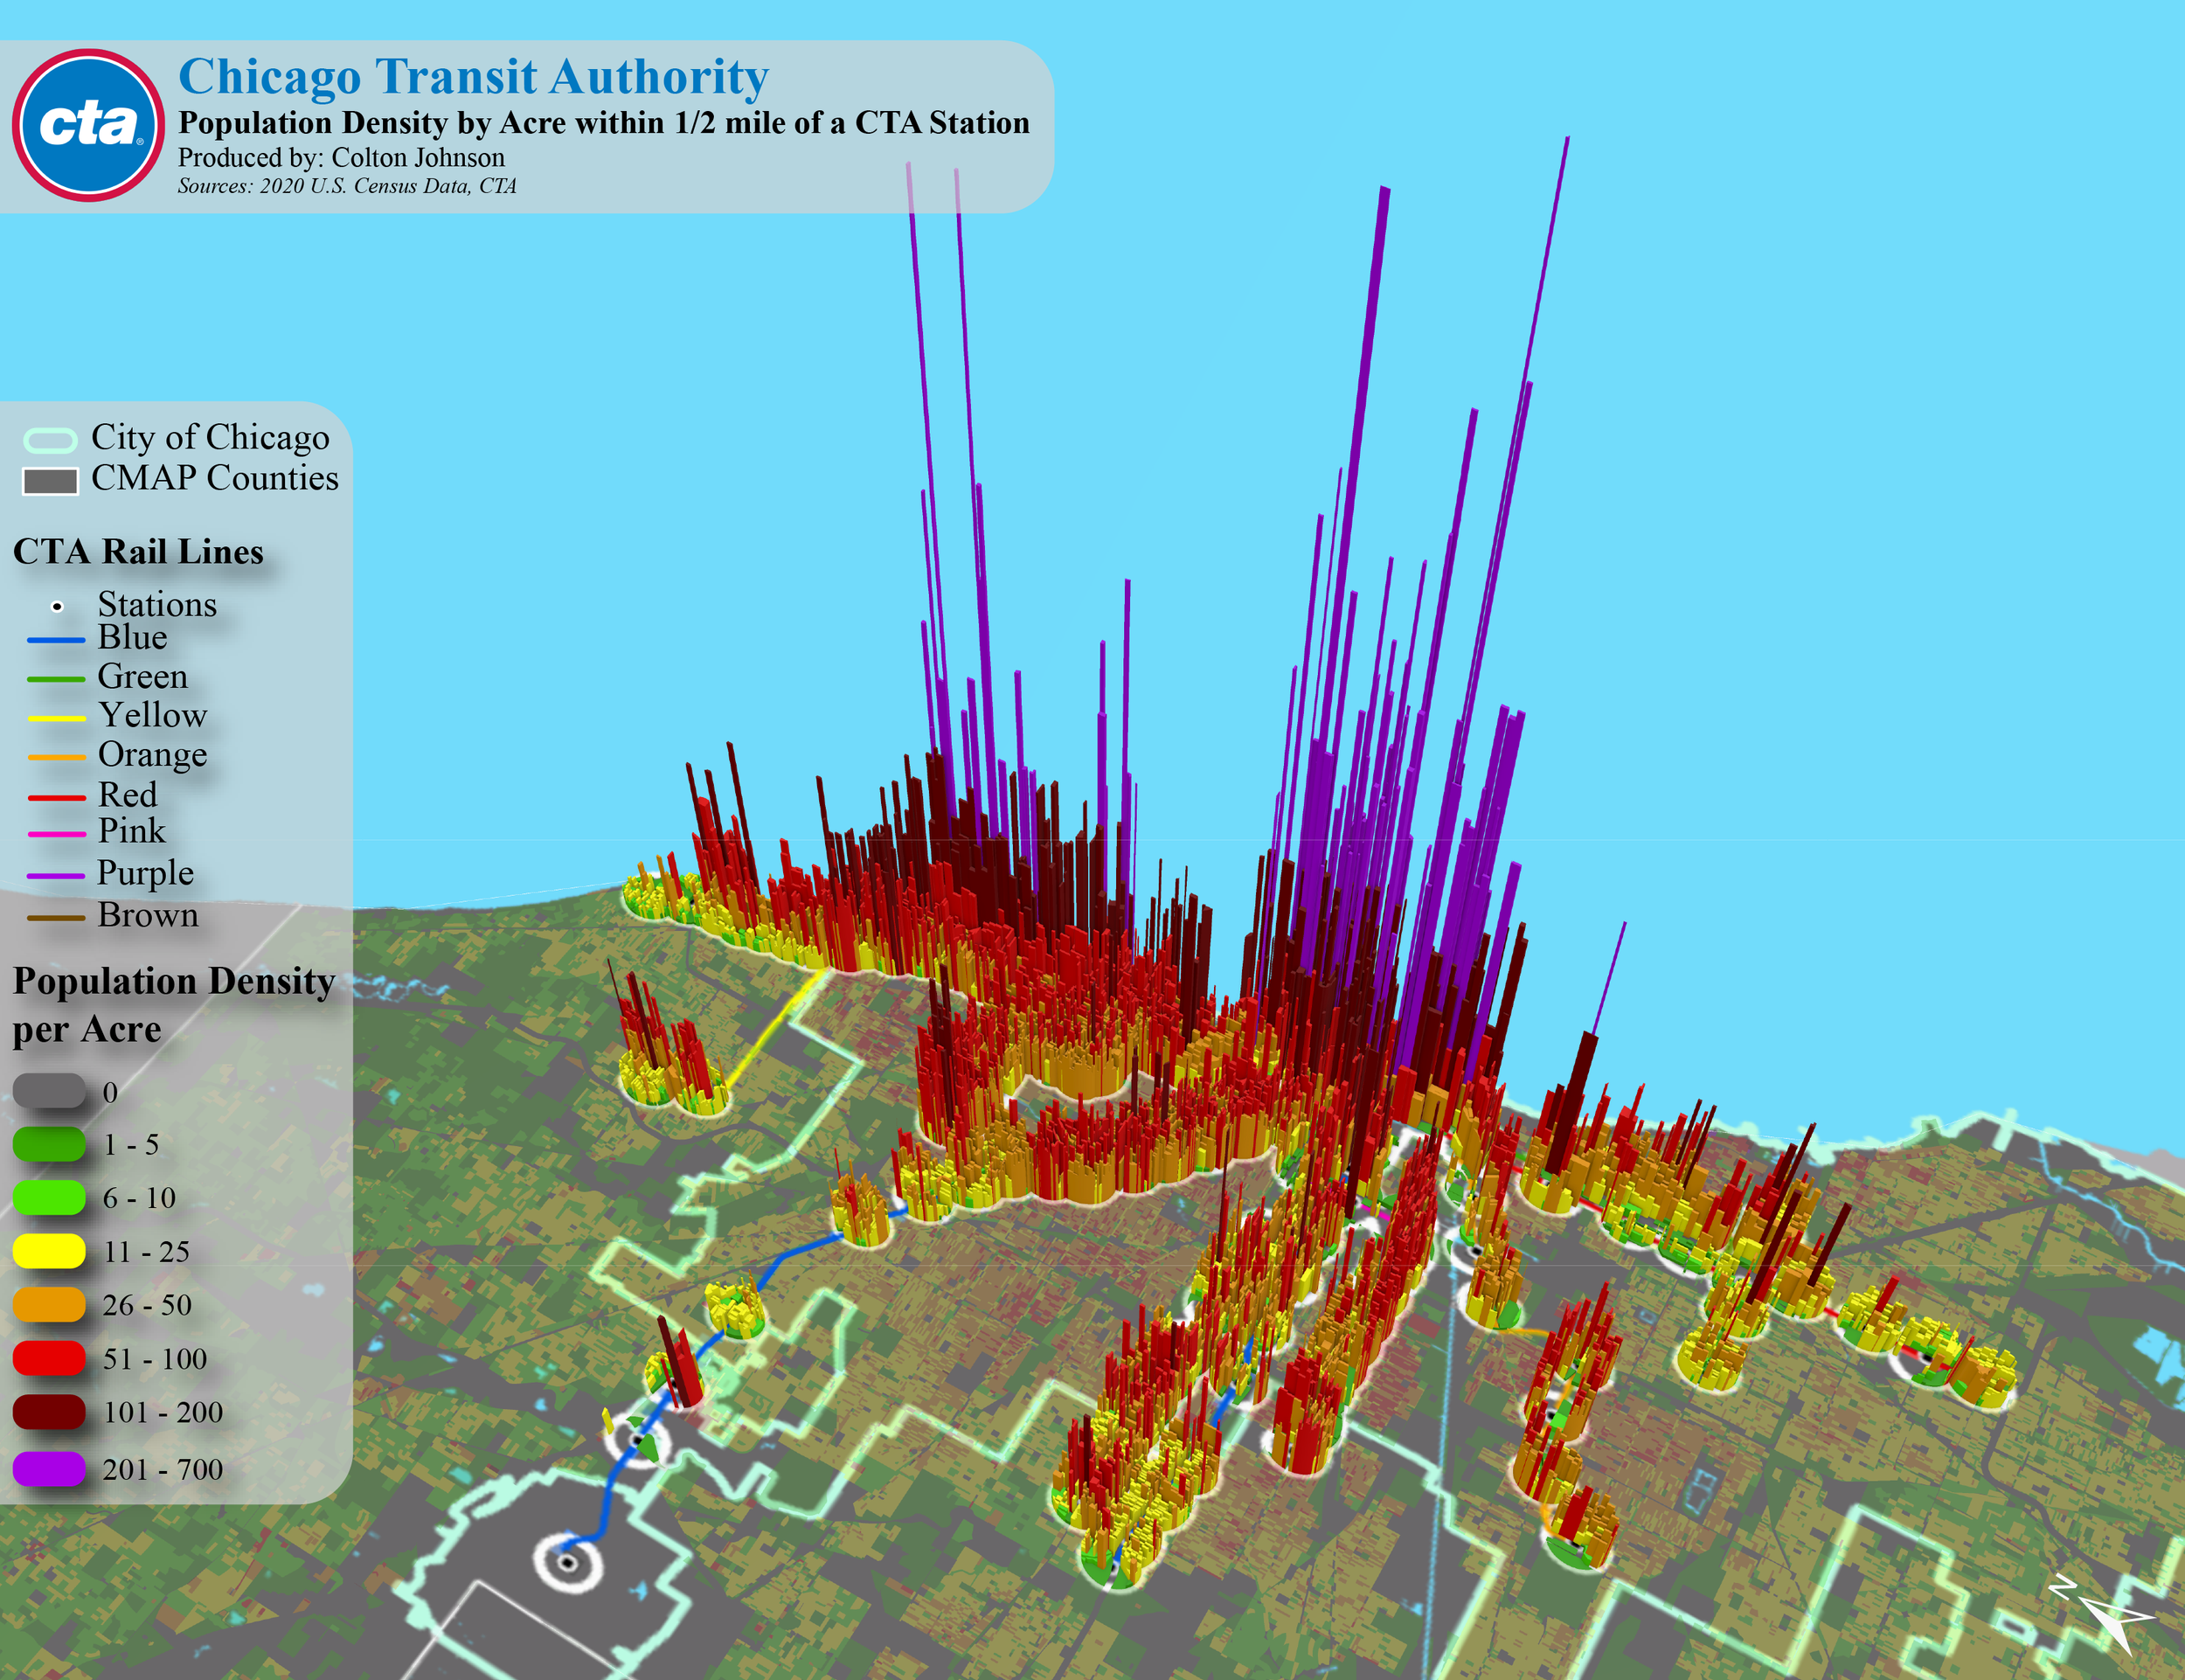

As planners, we understand that land use significantly affects how people utilize transportation. This could not be more true for heavy rail systems that depend on high densities and mixed-use land uses for ridership and high frequencies. Because of Chicago’s high residential densities immediately around CTA stations, the CTA not only sees higher daily ridership of 792,100 trips (2022) but can also support higher frequencies of trains. This vastly differs from MARTA’s daily average of roughly 92,400 daily trips (2023). Most MARTA stations have surrounding population densities similar of Metra commuter rail stations, despite MARTA being a heavy rail system. These low population densities limit ridership and in turn create high frequencies.
A simple glance between the map on the left (density along Atlanta’s MARTA system) vs the maps below (density along Chicago’s CTA and METRA systems) illustrate the significant differences between density around transit stations. Interestingly, and unsurprisingly, density around suburban METRA stations (commuter rail) is on par with most of Atlanta MARTA stations, served by heavy rail (a subway).
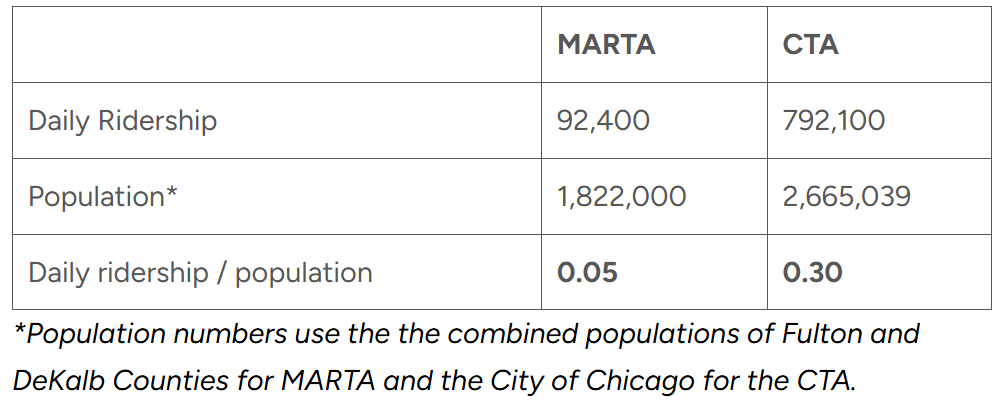
But these two systems serve two vastly different populations. By comparing these numbers on a per capita basis, a more accurate number can represent these differences. According to these numbers, daily MARTA trips can only account for 5% of the population whereas daily CTA trips can account up to 30% of the city population. The table below illustrates this.

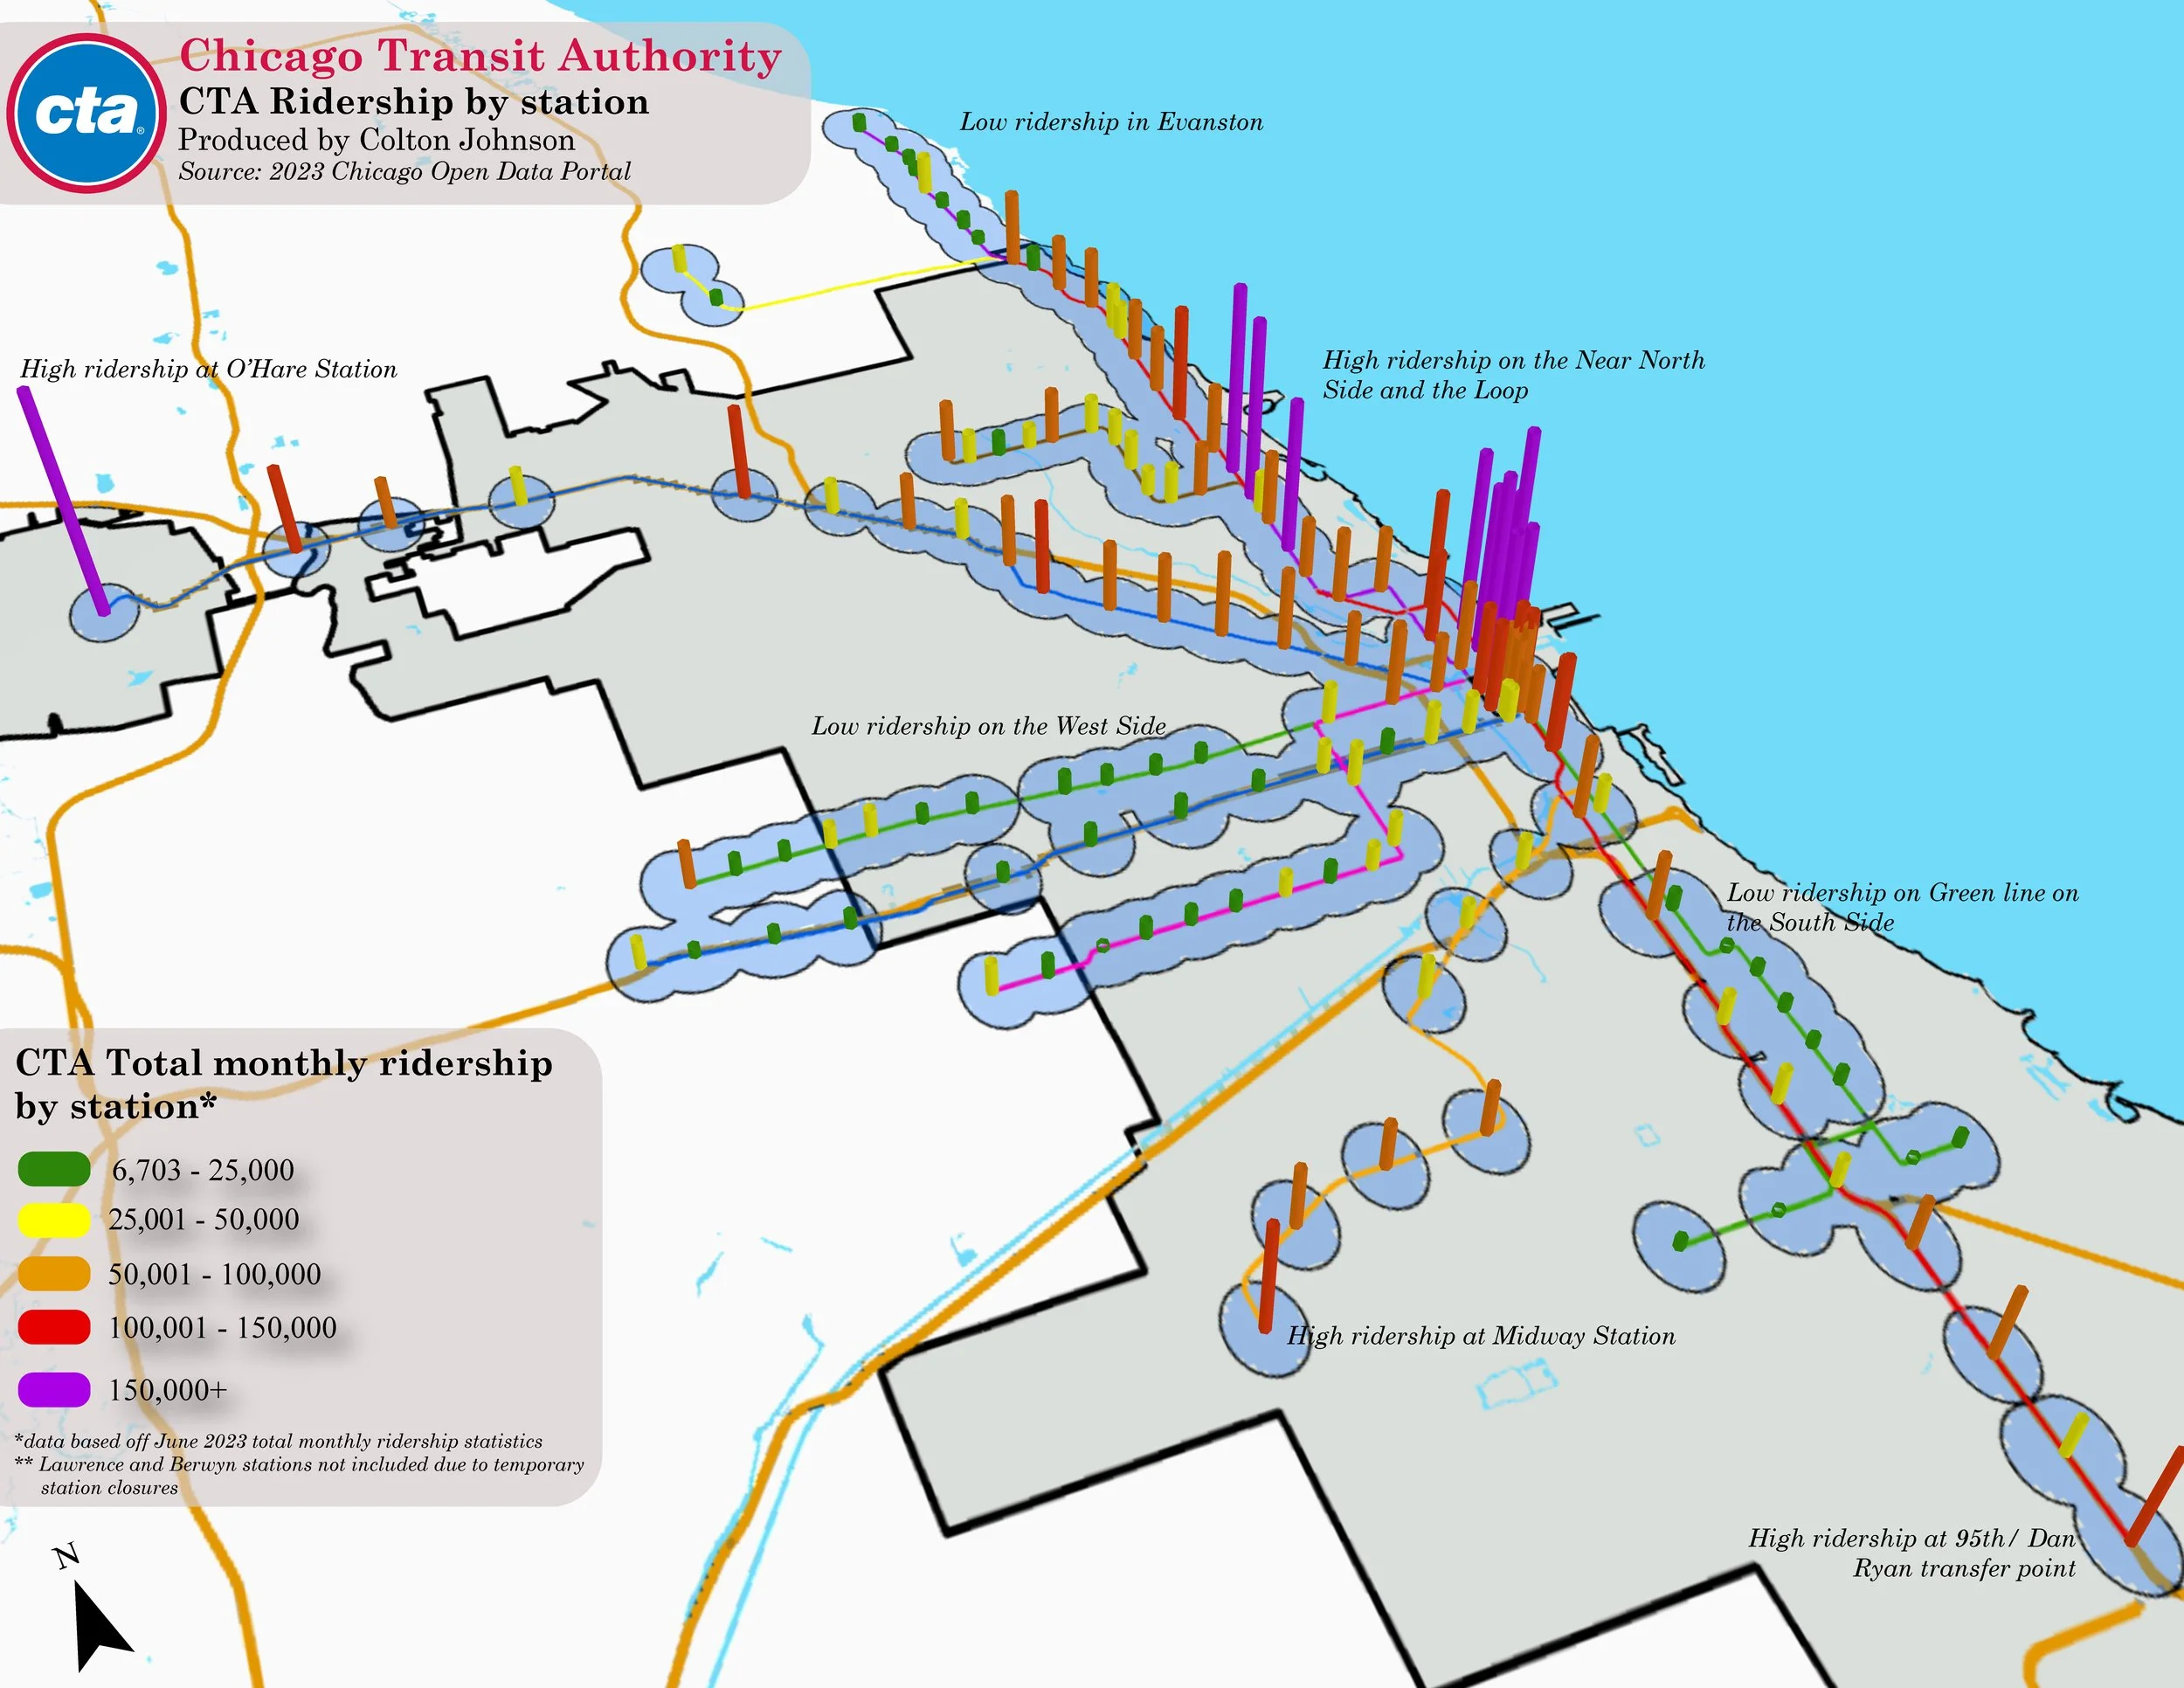
The continuing efficiency and success of older heavy rail systems can largely be attributed to how these rail stations are situated within an urban fabric. In Chicago, stations have historically been immediately built around concentrations of higher population density, commercial activity, and mixed-use centers. Without it, these rail services would likely not be profitable enough. Hence, the relationship between transportation and use is especially crucial in urban environments. Using 2020 U.S. Census Bureau block data and June 2023 monthly ridership data, I compared the average block density within a 1/2 mile of a CTA station and the total June 2023 monthly ridership counts to understand if there is still a relationship between population density and ridership.
Using polynomial regression, there appears to be a moderate, positive relationship between population density around a CTA station and (at least for the month of June 2023), station ridership. The scatterplot below shows each station’s average block density per acre and total monthly ridership for the month of June 2023. On average, as population density increases around stations, ridership does to, although it appears that a substantial increase in population density is necessary to see a moderate increase in monthly ridership. There are obvious outliers. as O’Hare Station has no population within 1/2 mile, but has one of the highest ridership counts in the entire system, due to its proximity to a large activity and international transportation center.