
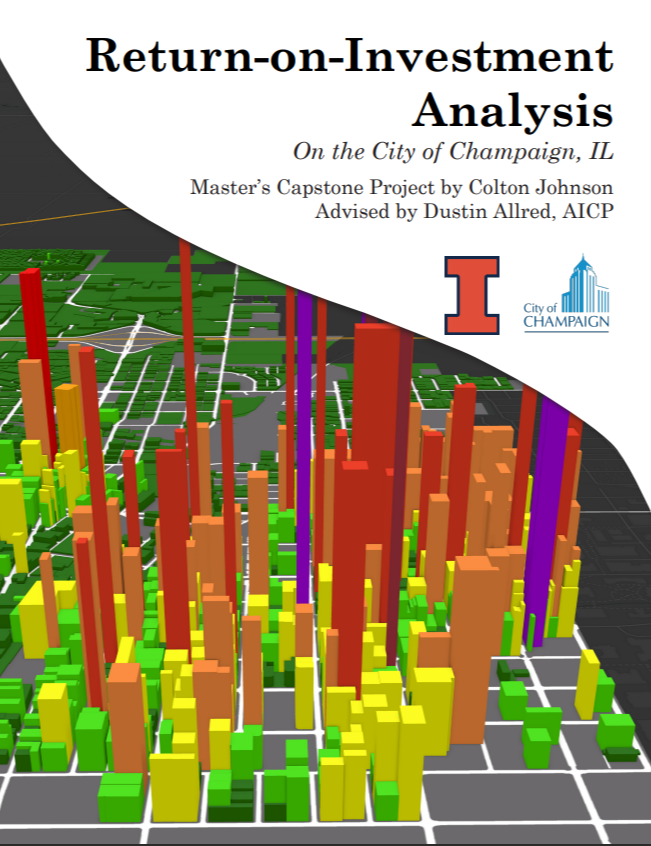
Return-on-Investment (ROI) Analysis on the City of Champaign
Guided by Strong Towns' principle of Transparent Local Accounting, I conducted a return-on-investment (ROI) analysis for the City of Champaign for my graduate capstone project. For each parcel in the city, I compared potential revenue streams—such as property and sales taxes—against the long-term costs of servicing and maintaining infrastructure (roads, water lines, sewers, and stormwater systems). This approach reveals which areas operate at a net-positive (revenues exceed costs) or net-negative (costs exceed revenues) balance.
The findings highlight a critical insight: The highest-ROI areas are those that generate the most revenue relative to their infrastructure demands, demonstrating efficient land use. Conversely, low-ROI neighborhoods—often characterized by sprawl or underutilized properties—place a disproportionate burden on municipal budgets. By identifying these patterns, this analysis provides a data-driven foundation for policymakers to prioritize investments, streamline services, and foster fiscally resilient development.
As a Strong Towns member and data visualization geek, I have long been attracted to Urban3’s stunning visualizations, illustrating the value of land within cities in a fascinating, understandable, and visually appealing 3D depiction. As a result, for my graduate capstone project, I conducted a Return-on-Investment Analysis on the City of Champaign, home to the University of Illinois. While my capstone cannot be as detailed or in depth as other analyses by Urban3, I expected similar results.
Urban3’s Return on Investment (ROI) analysis revolutionizes how cities evaluate fiscal sustainability by mapping the economic productivity of every parcel in a community. The video to the right illustrates this, and analyzes some ROI Analyses that Urban3 has conducted. Using geospatial data on property values, tax revenues, and infrastructure costs, their models reveal which neighborhoods generate a net fiscal surplus—where revenues (like taxes) exceed the long-term costs of services (roads, utilities, emergency response)—and which areas operate at a deficit due to inefficient land use or sprawl. By visualizing these patterns, Urban3 exposes hidden subsidies for low-density development and makes a compelling case for compact, mixed-use urbanism.

Capstone Report
This fiscal analysis evaluated the 2022 return on investment (ROI) for each parcel in Champaign by comparing sales and property tax revenues against FY 2022-23 Capital Improvements Program (CIP) expenditures. Initial hypotheses suggested that dense, mixed-use, and traditionally developed neighborhoods—particularly Downtown, Campustown, and pre-1950 areas like In-Town—would yield strong positive ROI values due to their efficient land use. Conversely, auto-centric zones (single-family subdivisions, big-box commercial corridors, agricultural land, and vacant parcels) were expected to show negative ROI, reflecting higher infrastructure costs relative to generated revenue.
The results revealed nuanced patterns. While Downtown Champaign emerged as the highest-ROI area—aligning with predictions—Campustown and certain auto-oriented commercial parcels also demonstrated unexpectedly robust returns. Surprisingly, some historic neighborhoods (including In-Town) posted slightly negative ROIs, challenging assumptions about pre-1950 development’s fiscal performance. As anticipated, agricultural and vacant lands ranked lowest, underscoring their fiscal strain.
Limitations and Future Directions
This study’s scope had notable constraints:
Revenue Streams: Critical sources like income taxes, TIF revenues, and hospitality taxes (hotel/food/beverage) were excluded, potentially underrepresenting the fiscal impact of high-activity areas like Downtown and Campustown.
Expenditure Granularity: Infrastructure costs were broadly split between arterial-fronting parcels (40% of CIP expenditures) and non-arterial parcels (60%), masking variations in utility maintenance, road types, or service demands.
Future analyses could refine accuracy by incorporating omitted revenues and disaggregating costs by infrastructure type (e.g., sewer vs. road repairs). Such adjustments would clarify disparities—for instance, whether auto-centric zones’ ROI is artificially inflated by unaccounted subsidies or if historic neighborhoods’ underperformance stems from aging infrastructure burdens.
Further content below.
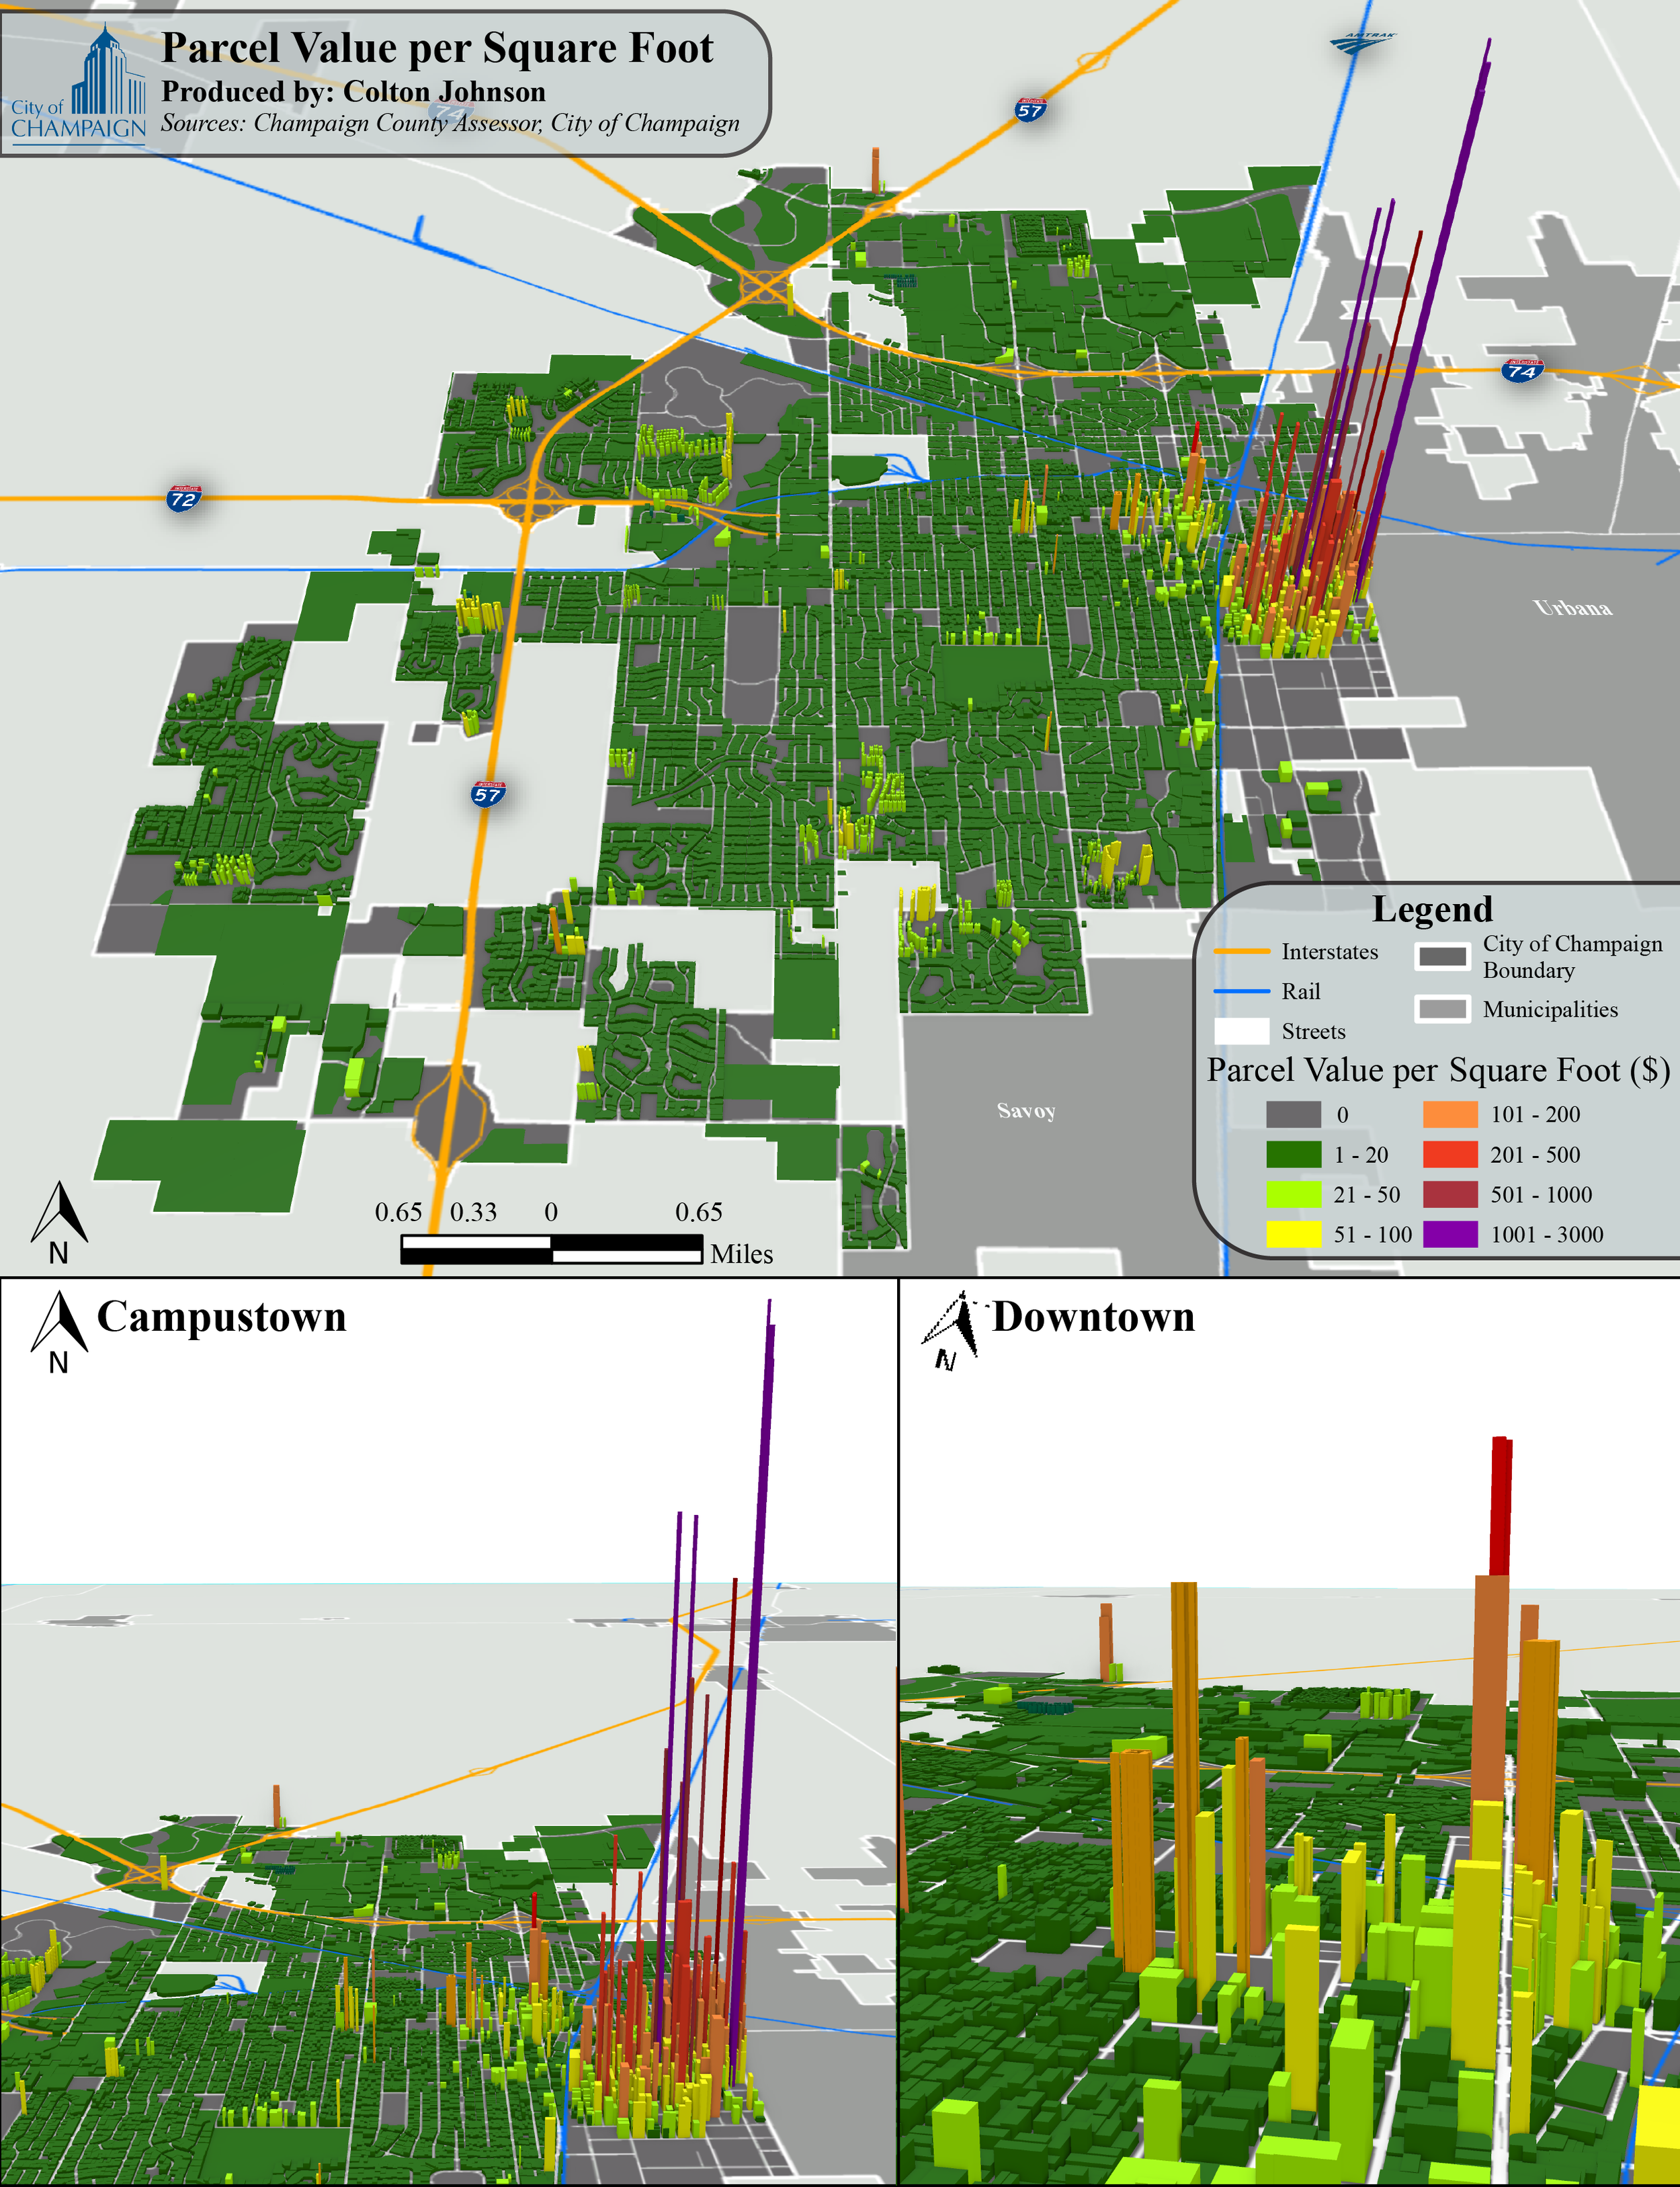
The two maps to the right reveals the striking disparities in land value efficiency across Champaign by visualizing the assessed value per square foot of every parcel. This spatial analysis highlights how certain neighborhoods generate extraordinary economic value from minimal land area—a key metric of urban productivity.
Campustown emerges as the clear standout, with land values soaring as high as $1,000 per square foot—a figure that rivals dense urban cores like Downtown Chicago. This compact neighborhood, housing tens of thousands of University of Illinois students, packs immense value into just a few blocks through high-rise multifamily buildings and mixed-use developments.
Downtown Champaign, the city’s historic center, claims the second-highest values—though its numbers are eclipsed by Campustown’s staggering density. This inversion defies the typical mid-sized city pattern where downtowns dominate land value rankings.
Beyond these hotspots, most of the city’s parcels hover between $10–$20 per square foot, reflecting lower-density auto-oriented development. Notable exceptions include efficiently designed condo buildings and luxury single-family homes, which appear as high-value outliers in an otherwise flat landscape.
Value per square foot
Further content below.
supporting maps


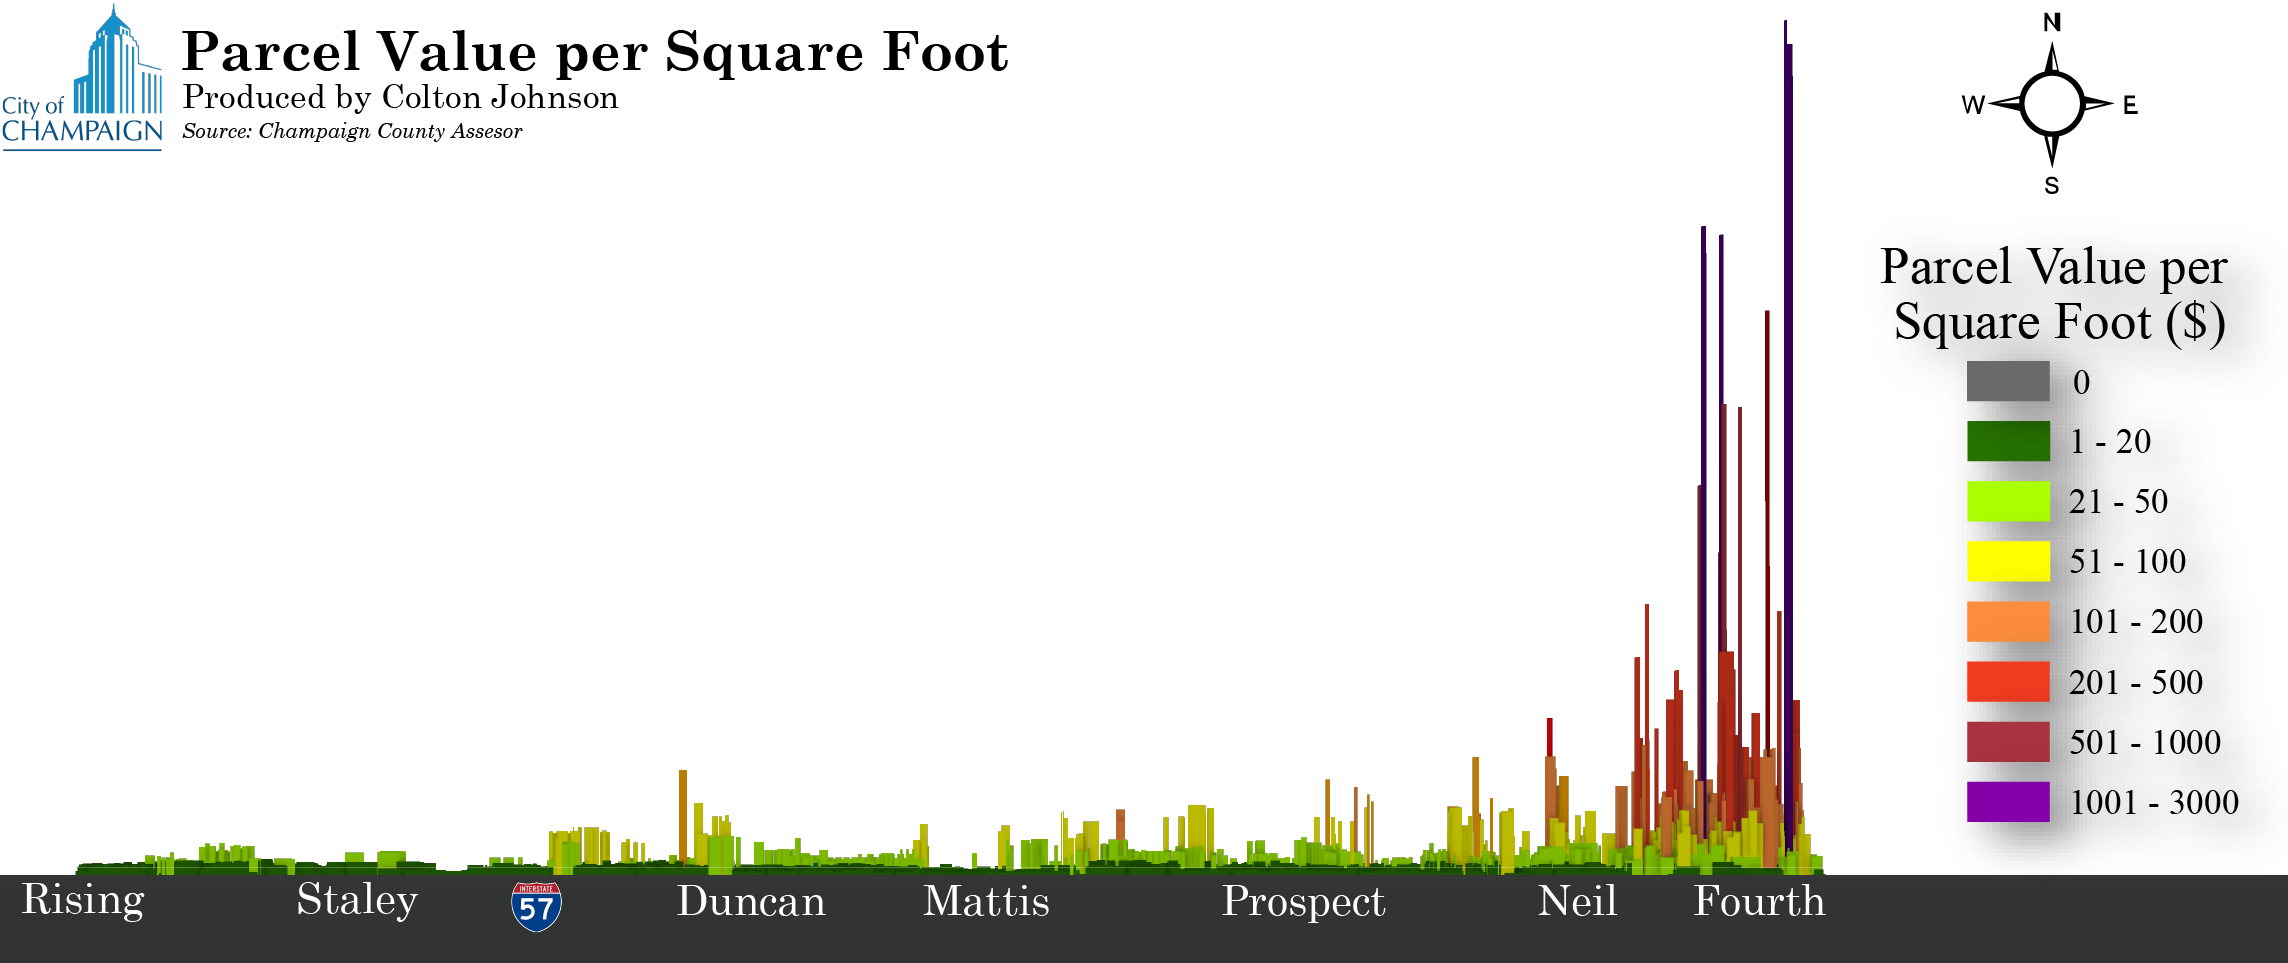
Furthermore, the following maps on the left powerfully reinforce the correlation between density, land use efficiency, and economic value. The data clearly demonstrates that areas with high residential density and multifamily development consistently achieve significantly higher values per square foot. This urban form represents a fiscal win-win: generating greater tax revenues per acre while consuming fewer public resources through more efficient use of land, reduced road infrastructure demands, and lower per-capita maintenance liabilities.
Yet despite this compelling economic logic, American zoning codes systematically suppress these high-performing development patterns. Restrictive single-family zoning, arbitrary density caps, and prohibitions against multifamily housing dominate municipal land use regulations, effectively banning the very forms of development that generate the greatest fiscal returns for cities. This regulatory paradox helps explain why so many communities struggle with infrastructure funding gaps and strained municipal budgets, even as they actively discourage their most financially productive land uses.