mapping population density in the washington d.c. metropolitan area
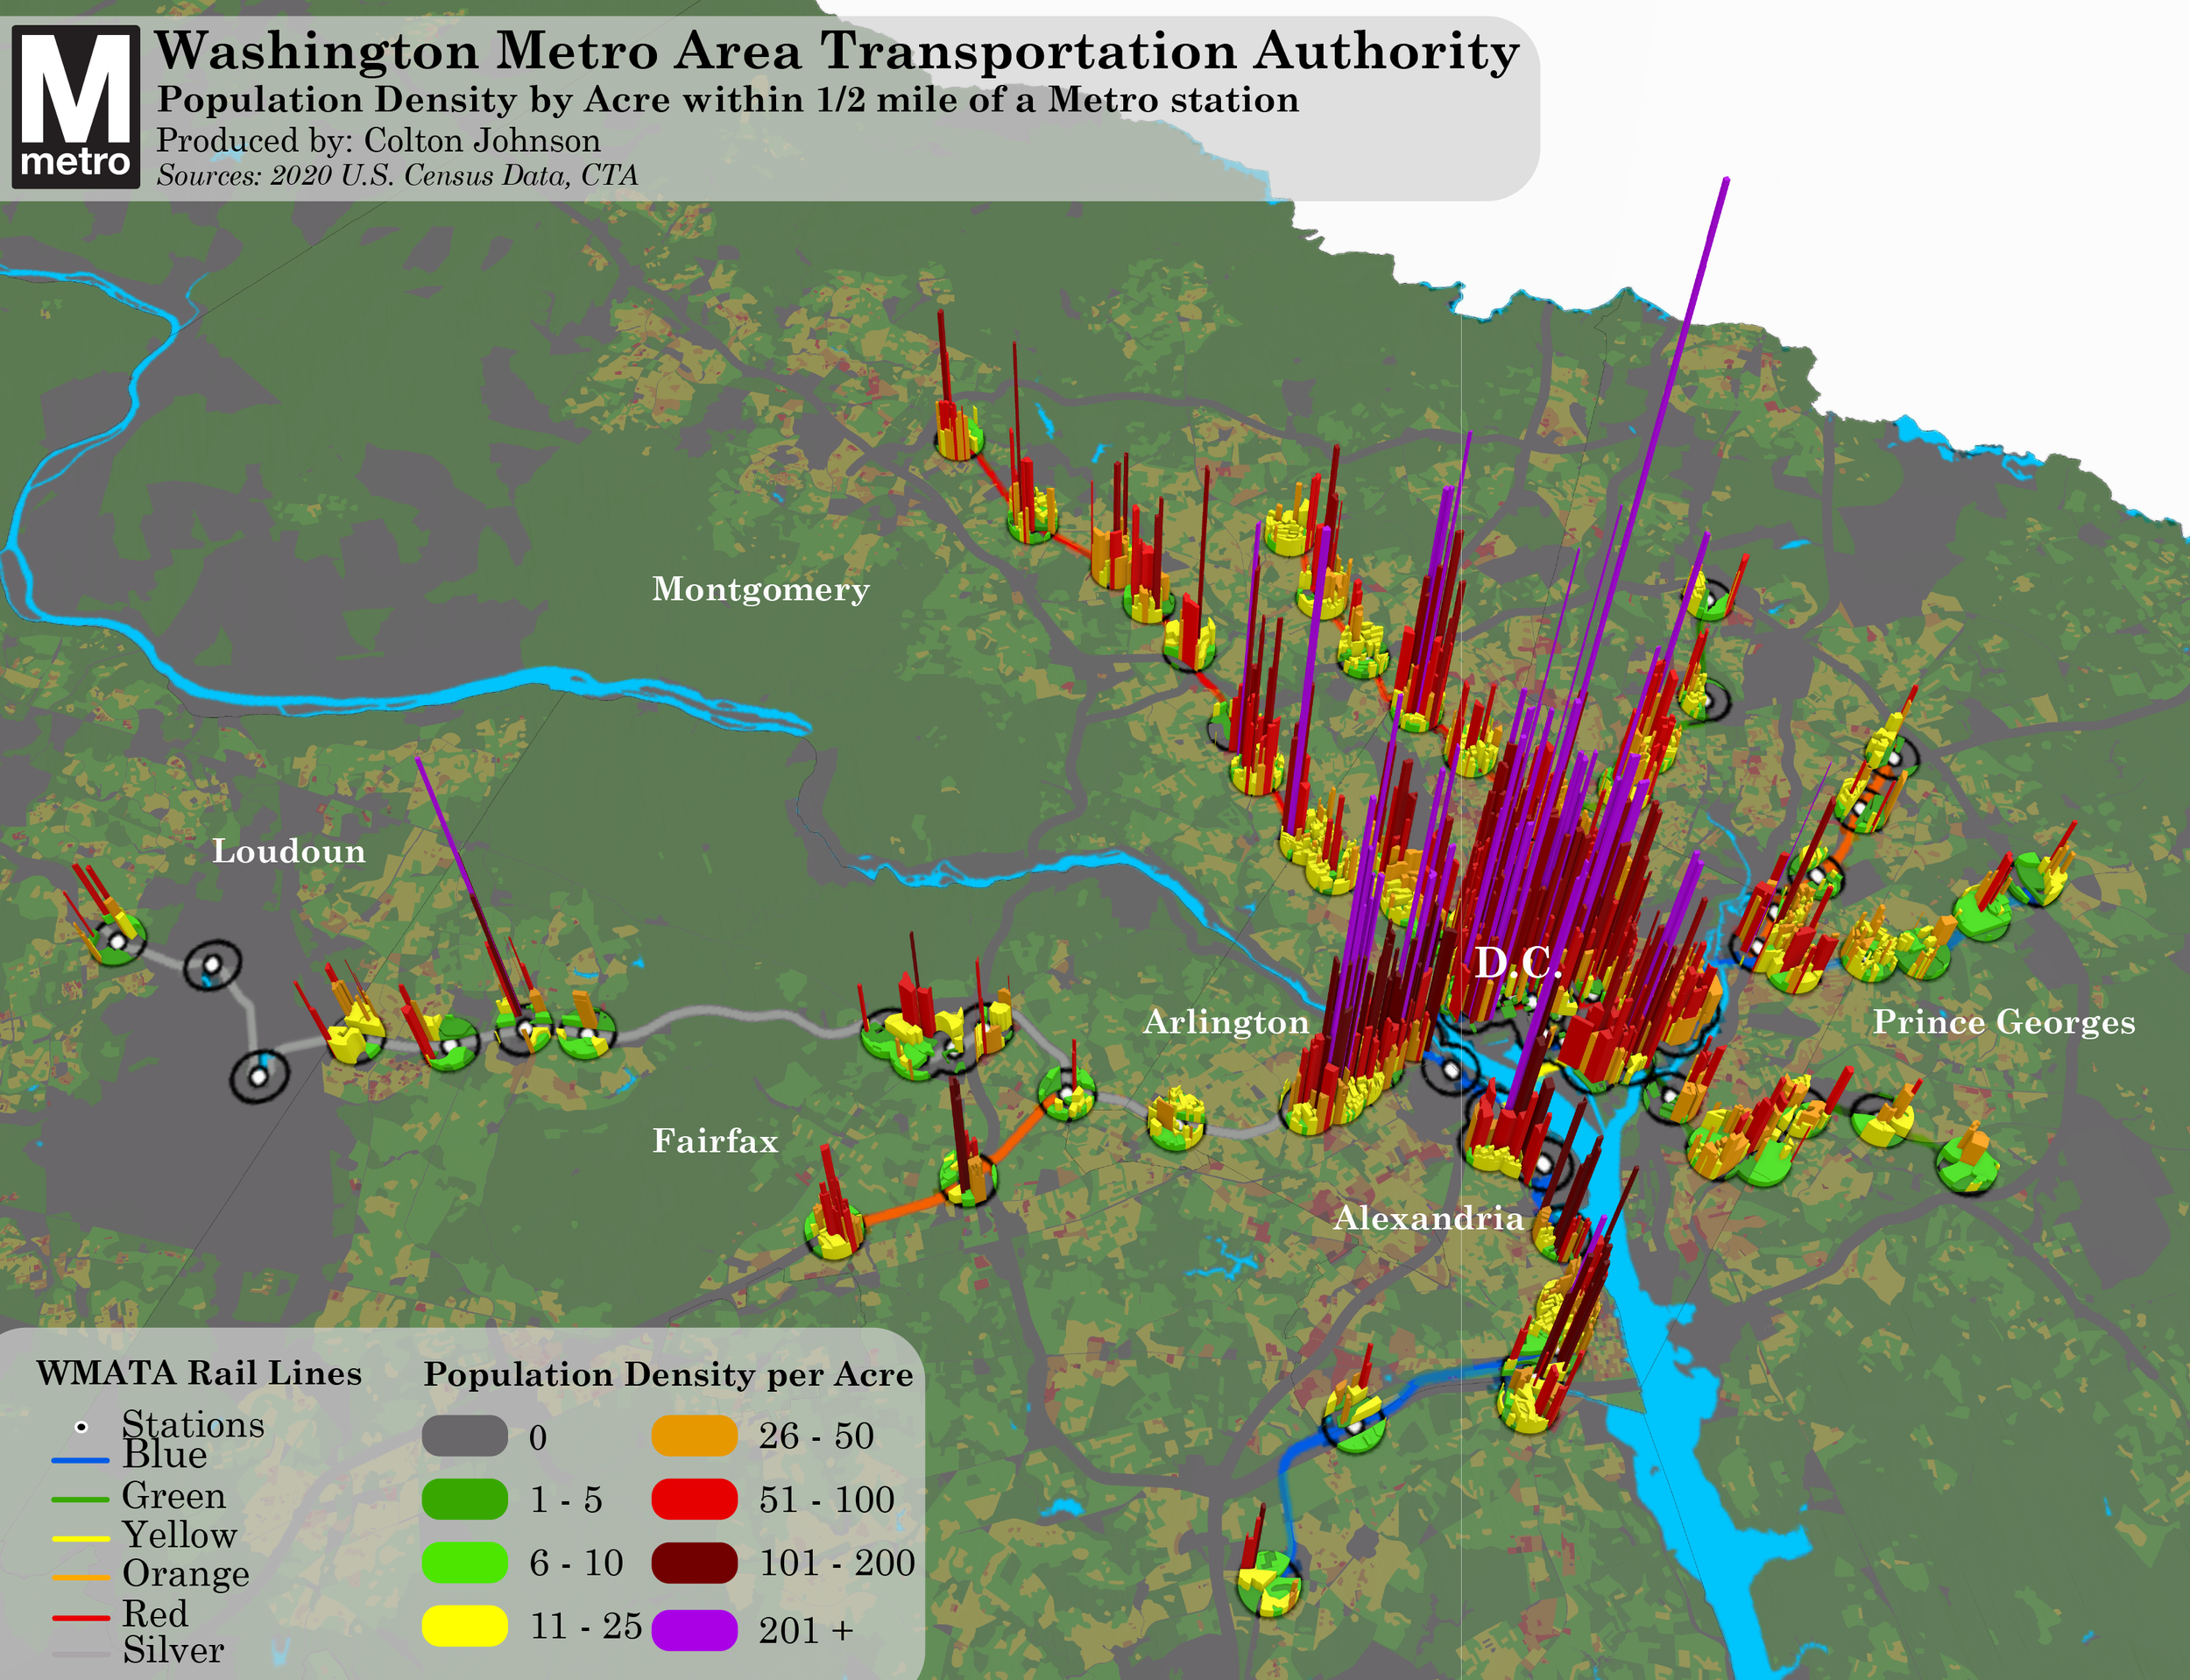
These four maps illustrate population density by U.S. Census block in the D.C area. Unsurprisingly, population generally clusters in and around D.C. Yet, it is also important to visualize population density around Metro Stations, as many governments in the area have been focusing denser and mixed-use development around station areas.
The first two maps show population density within a 1/2 mile of a Metro station. New mixed-use and multi-family developments around station areas have resulted in increases in population density within the past decade, especially in Montgomery County at Silver Spring, Friendship Heights, Shady Grove and Bethesda stations.
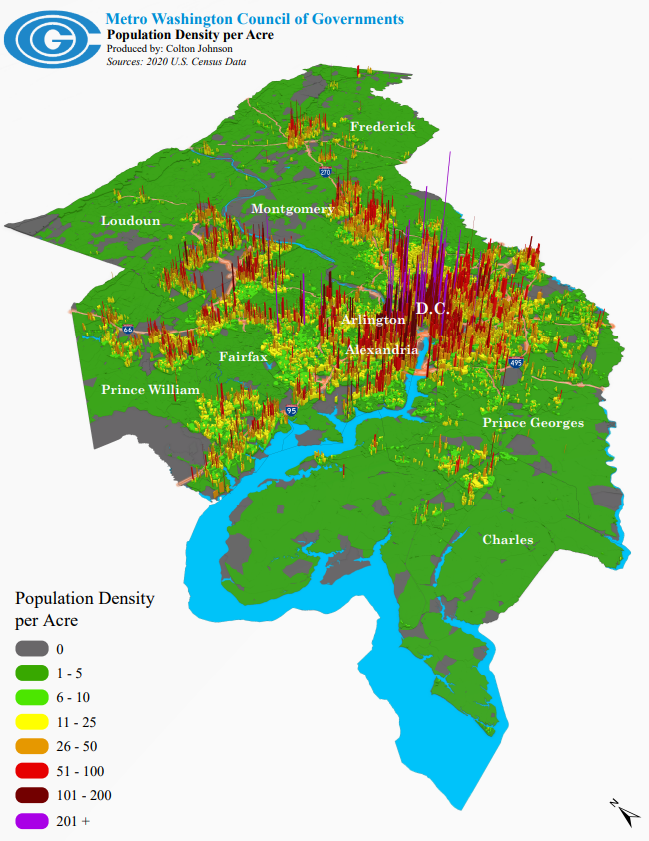
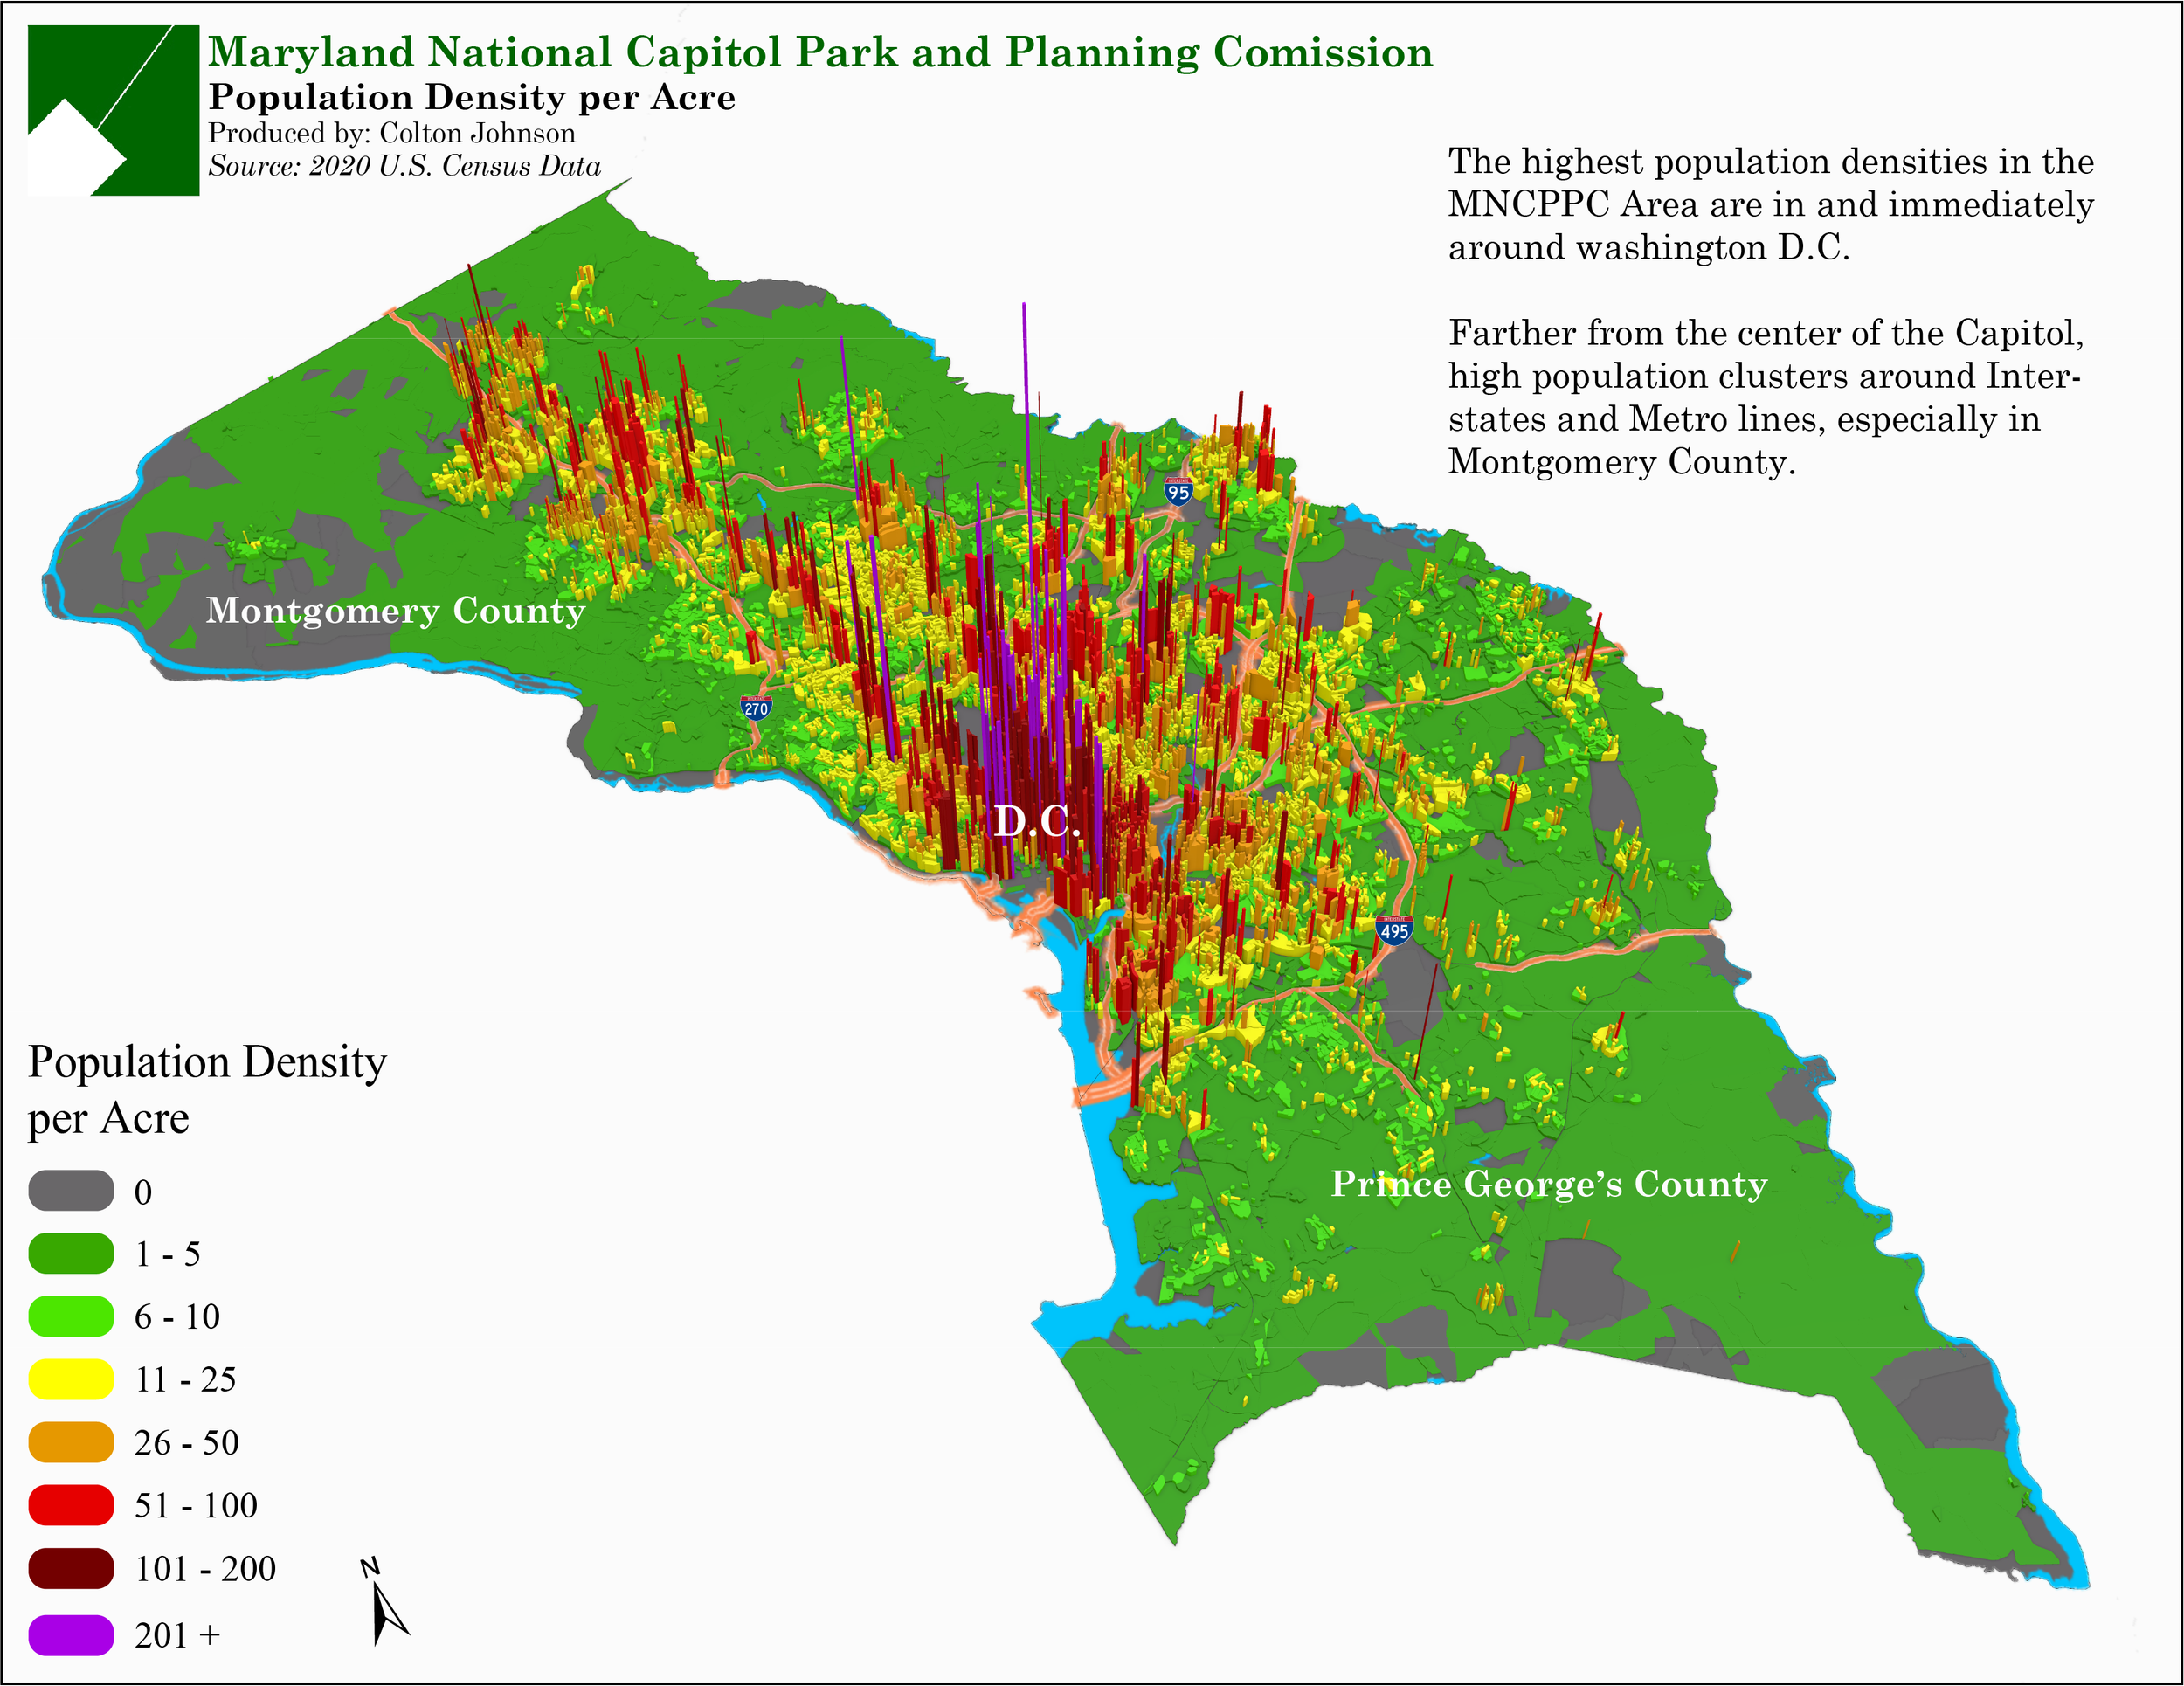
In the Metro DC area, population density patterns reflect a mix of urban, suburban, and low-density exurban development. Washington, D.C. itself has the highest density, particularly in neighborhoods like Dupont Circle, Columbia Heights, and Downtown, where high-rise apartments and mixed-use developments dominate. Surrounding inner suburbs, such as Arlington and Silver Spring, also feature high-density residential and commercial zones, supported by robust transit networks like Metro. Mid-distance suburbs, including Fairfax and Montgomery County, transition to lower-density single-family homes and sprawling subdivisions. Farther out, exurban areas like Loudoun and Prince William Counties have even lower densities, with rural pockets interspersed with newer suburban developments. These patterns highlight the region’s radial structure, with density declining as distance from the urban core increases, though transit-oriented development continues to shape growth in key corridors.