Zionsville Comprehensive Plan
One of Zionsville’s greatest points of pride is its beautifully preserved Downtown Village, a charming district where nineteenth-century buildings line a peaceful Main Street, offering the feeling of stepping back in time. Just 20 miles from downtown Indianapolis, the Town has experienced significant growth in recent decades, driven by two township mergers and encroaching suburban expansion. Today, Zionsville’s built environment ranges from sprawling agricultural land to suburban-style subdivisions and estates, with the Village representing the Town’s small pocket of traditional neighborhoods. Recognizing these contrasting identities, our team worked closely with the community to develop a new Comprehensive Plan (including a new Throughfare Plan and Economic Development Plan) that both honors Zionsville’s historic character and provides a clear vision for sustainable, well-guided growth. Through extensive public engagement, including workshops, surveys, and stakeholder meetings, we have completed the majority of the input phase and are now refining the plan’s strategies. Adoption is anticipated in Fall 2025.
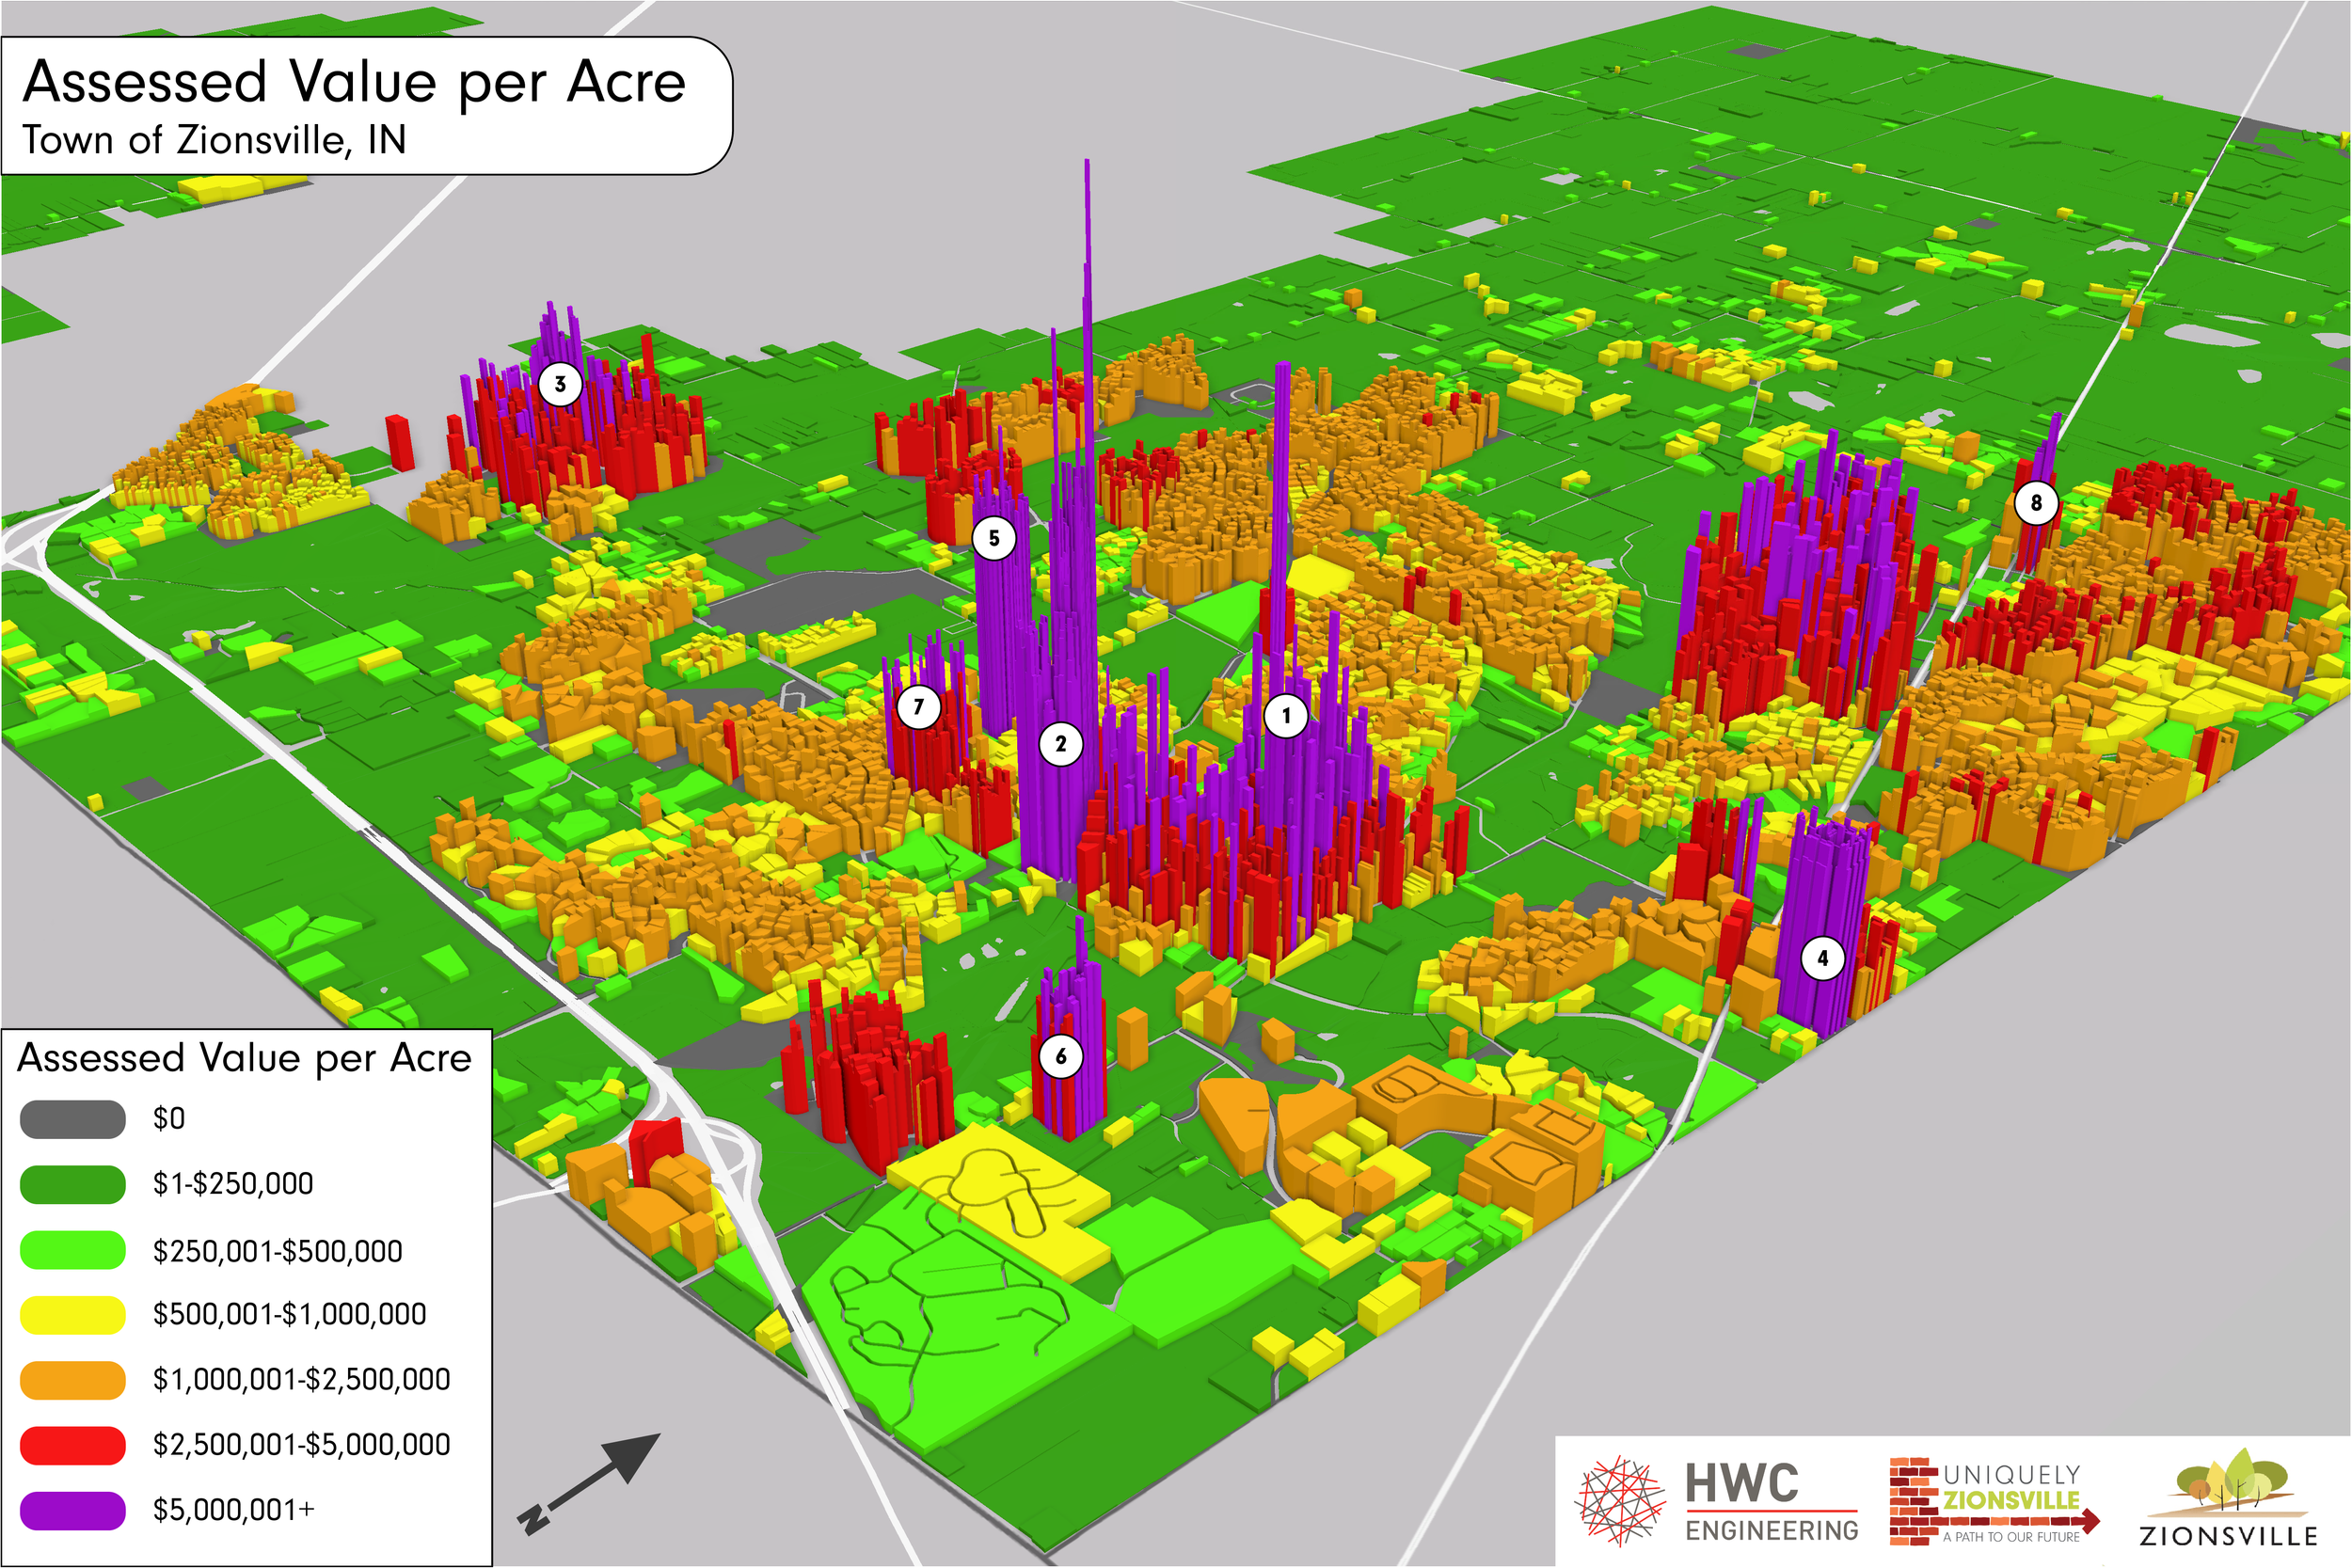
The following maps illustrate each parcel's assessed value which are generated from the Boone County Assessor’s Office. Assessed values are also used to derive property taxes, as the local property tax rate is applied to each parcel’s assessed value. Zionsville relies heavily on its property taxes to fund its public services, and while this analysis does not incorporate other funding sources, this analysis can capture a glimpse as to which areas generate the highest values, relative to the amount of land they use, and hence, costly infrastructure they require to be serviced and maintained over time.
Parcels that pay no property taxes (or have no value) are shown in dark grey. Lowest values are shown in dark green, while highest values are shown in purple. Values in gray have no data. Parcels in residential subdivisions with common areas or open space (often valued at $0) are all merged to reflect the space taken by common or open space areas. Some examples of these ‘merged’ subdivisions include Royal run and The Willows.
Overall, areas with the highest value per acre ($5,000,000+/acre) are often in The Village, multifamily developments, traditional neighborhood developments, or high-end homes. Some developments include Manchester Square Townhomes (2), commercial businesses in The Village (1), and Holiday Farms. Areas with the lowest value per acre (under $250,000) are often agricultural areas and rural residential areas, especially in North and West Zionsville and South of I-865. Areas in the middle range ($500,000-$2,500,000/acre) are often suburban residential subdivisions such as Cobblestone Lakes and Royal, suburban-style commercial shopping centers such as Boone Village, and new warehouse developments.
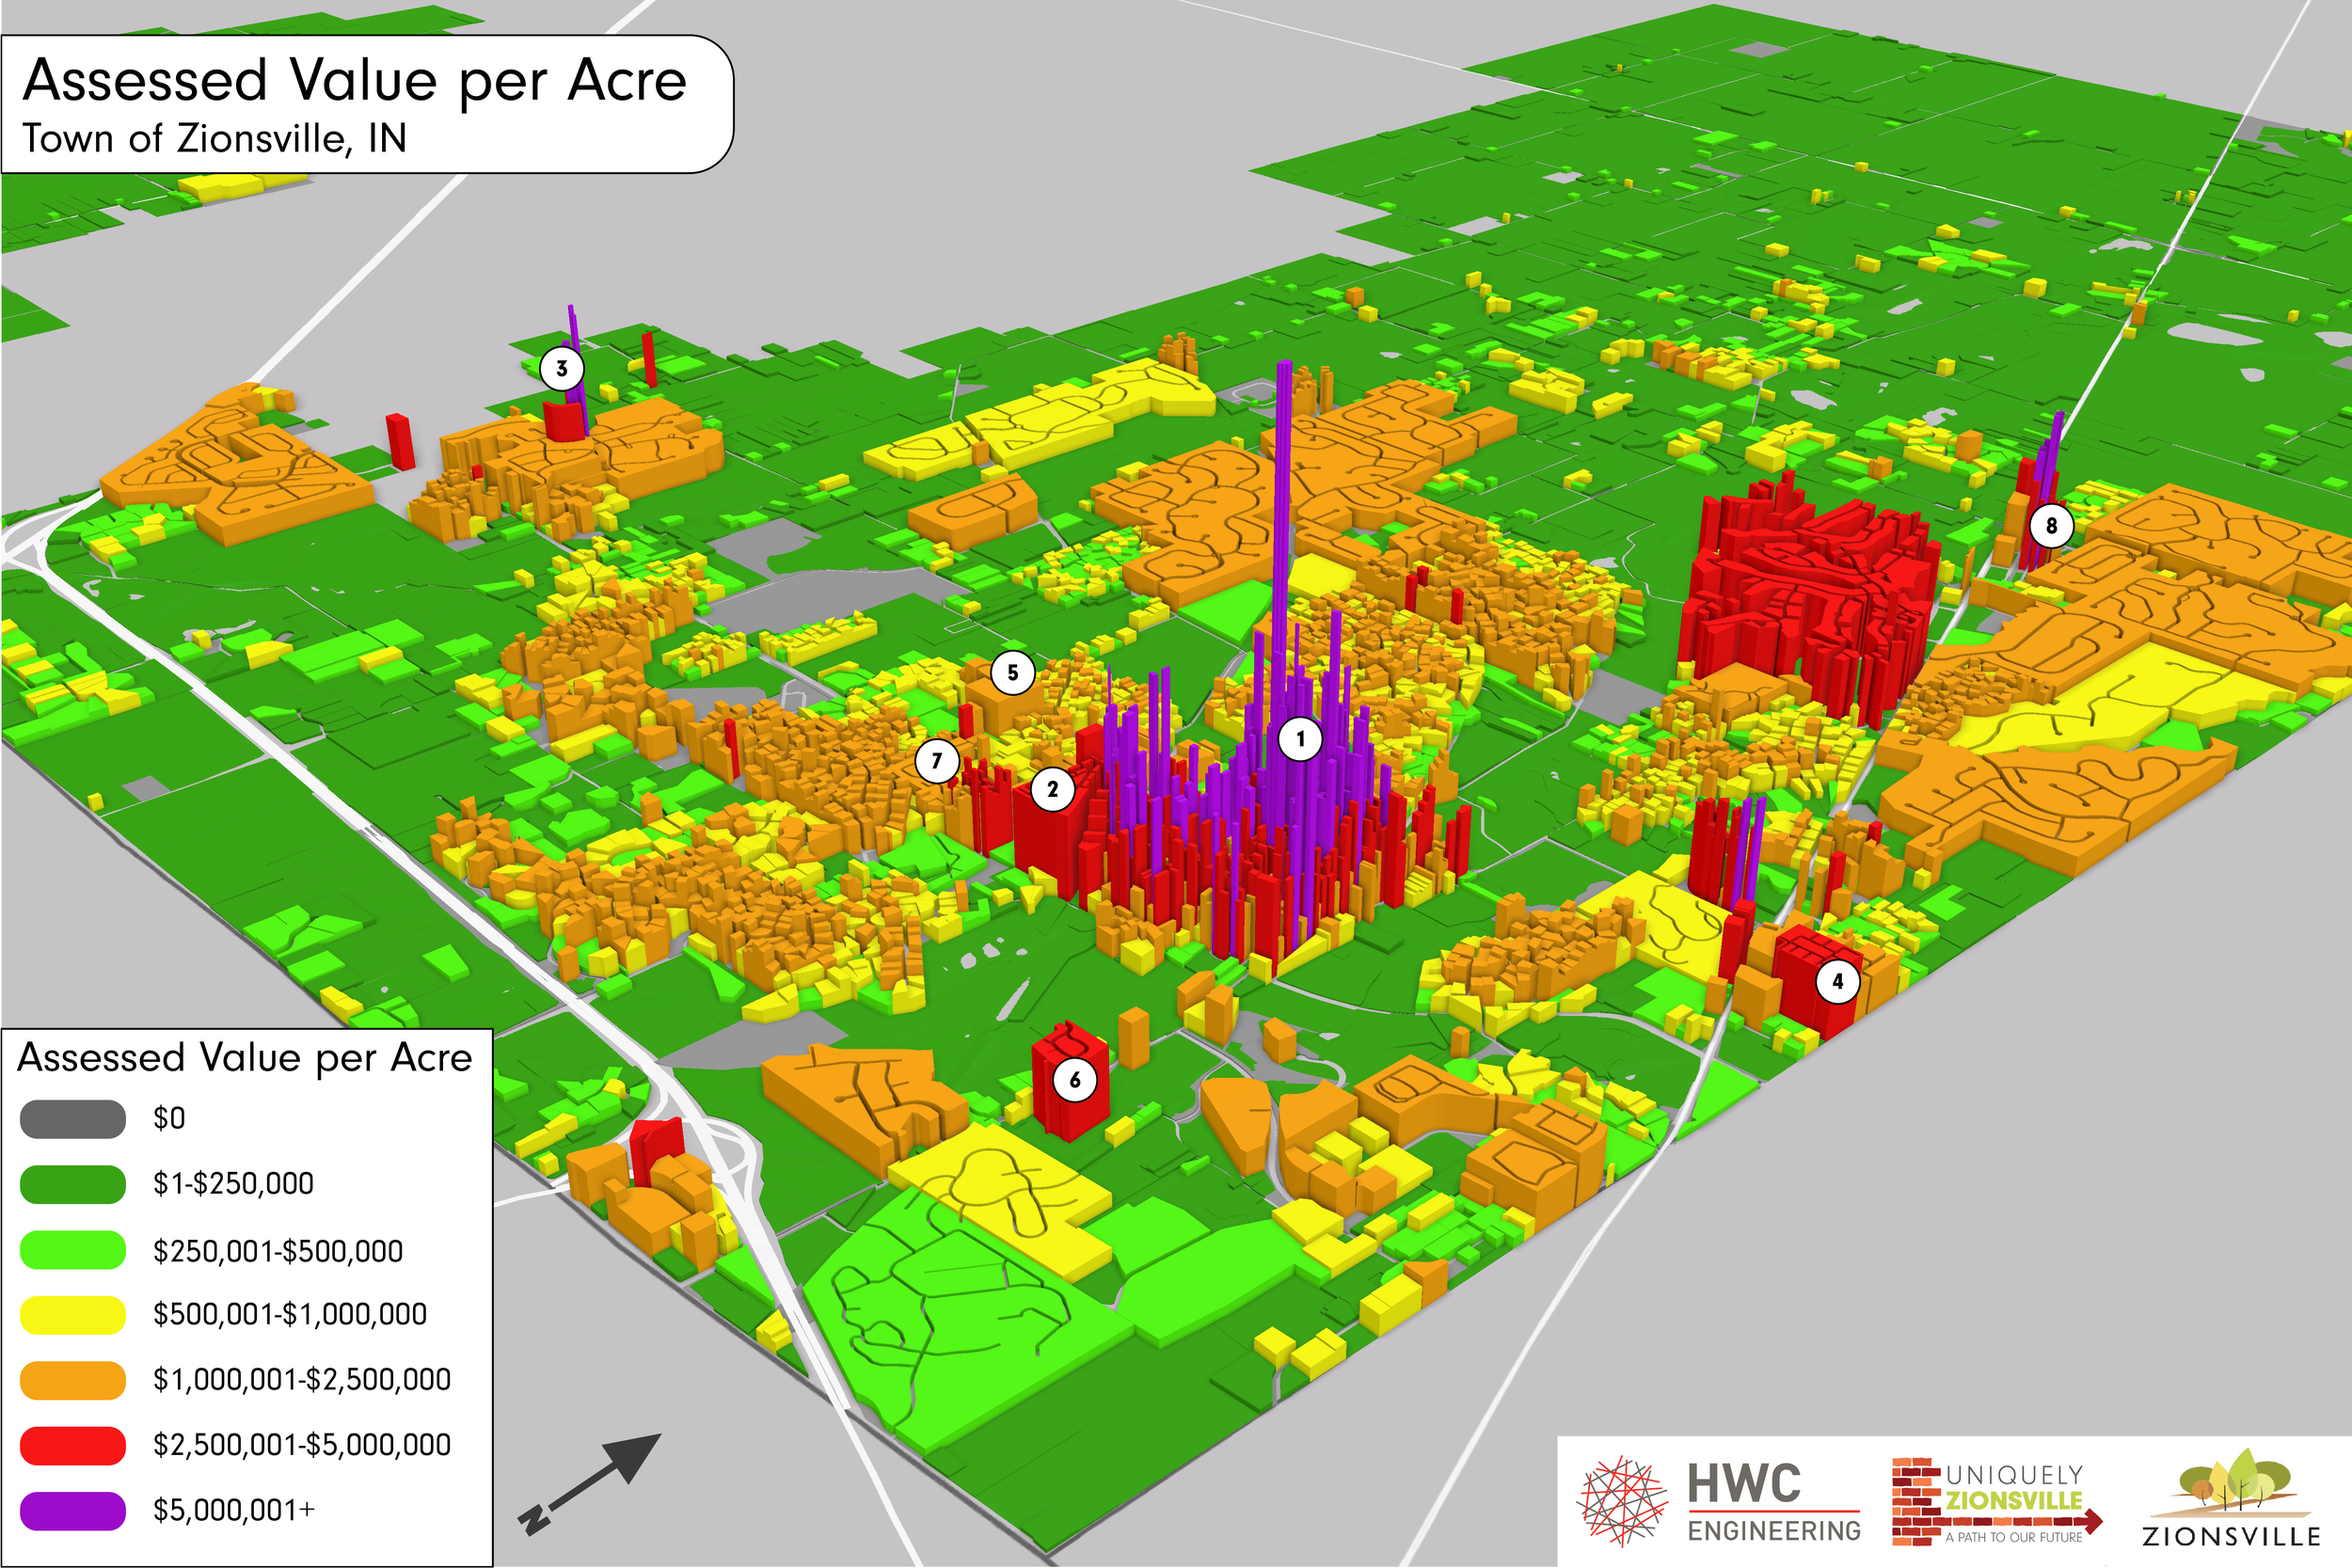
The top map does not accurately represent the impact of commonly-owned lands that are usually owned by HOAs and are not taxed, meaning they have no value. With most subdivisions owning large swaths of common land, the map below illustrates a more accurate value-per-acre metric. This metric combines all parcels and common land into one parcel for each subdivision in the Town. For example, #2 on the map above had values over $5,000,000 an acre when not taking into account the commonly owned land each parcel maintains. The map below shows #2 as one parcel, and includes the addition of commonly owned land. By doing so, its overall value-per-acre is roughly $3,000,000. The same trend is evident in #5 #4, and #7, as their values in the map below are lower than in the map above.
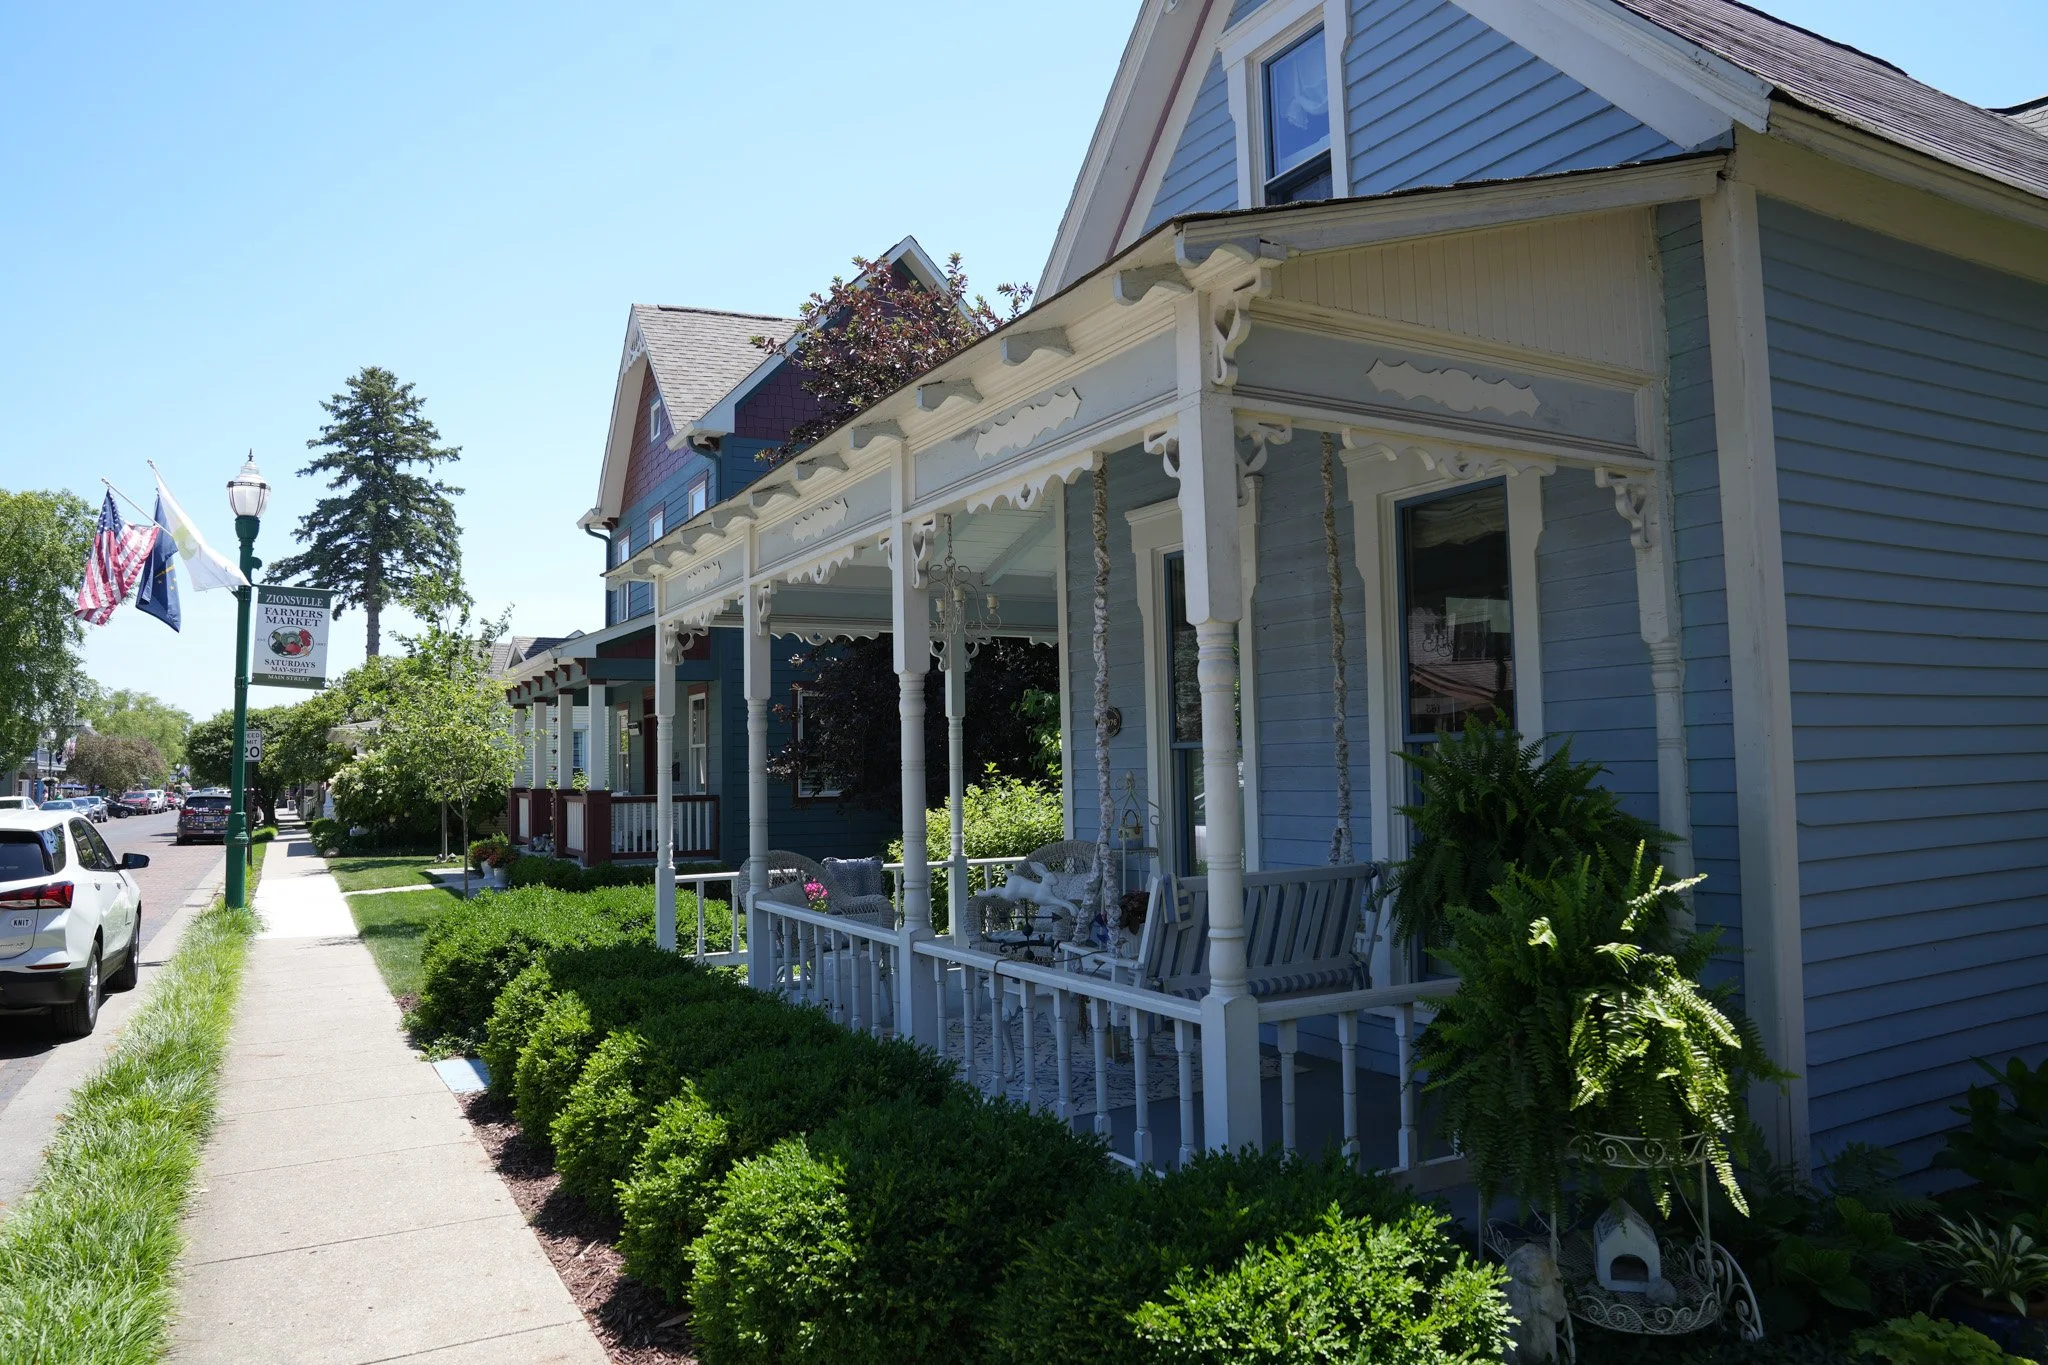
The bottom map illustrates a more accurate picture of the areas in the Town that have the highest values per acre. #1, The Village, unsurprisingly boasts the highest values per ace with its traditional, mixed-use buildings holding a small footprint with high values. Other areas such as Stonegate (3), Manchester Square (2), Inglenook (6), and Towns at Appaloosa Crossing (8) having some of the next highest values per acre. What all these areas have in common is that they are slightly denser than standard subdivisions, but are still built at an comfortable human scale, and often apply traditional neighborhood design standards. Some are mixed-use, and blend commercial and residential uses. The following images show what kinds of development these areas of look like:
Zionsville Value per Acre ANALYSIS
1
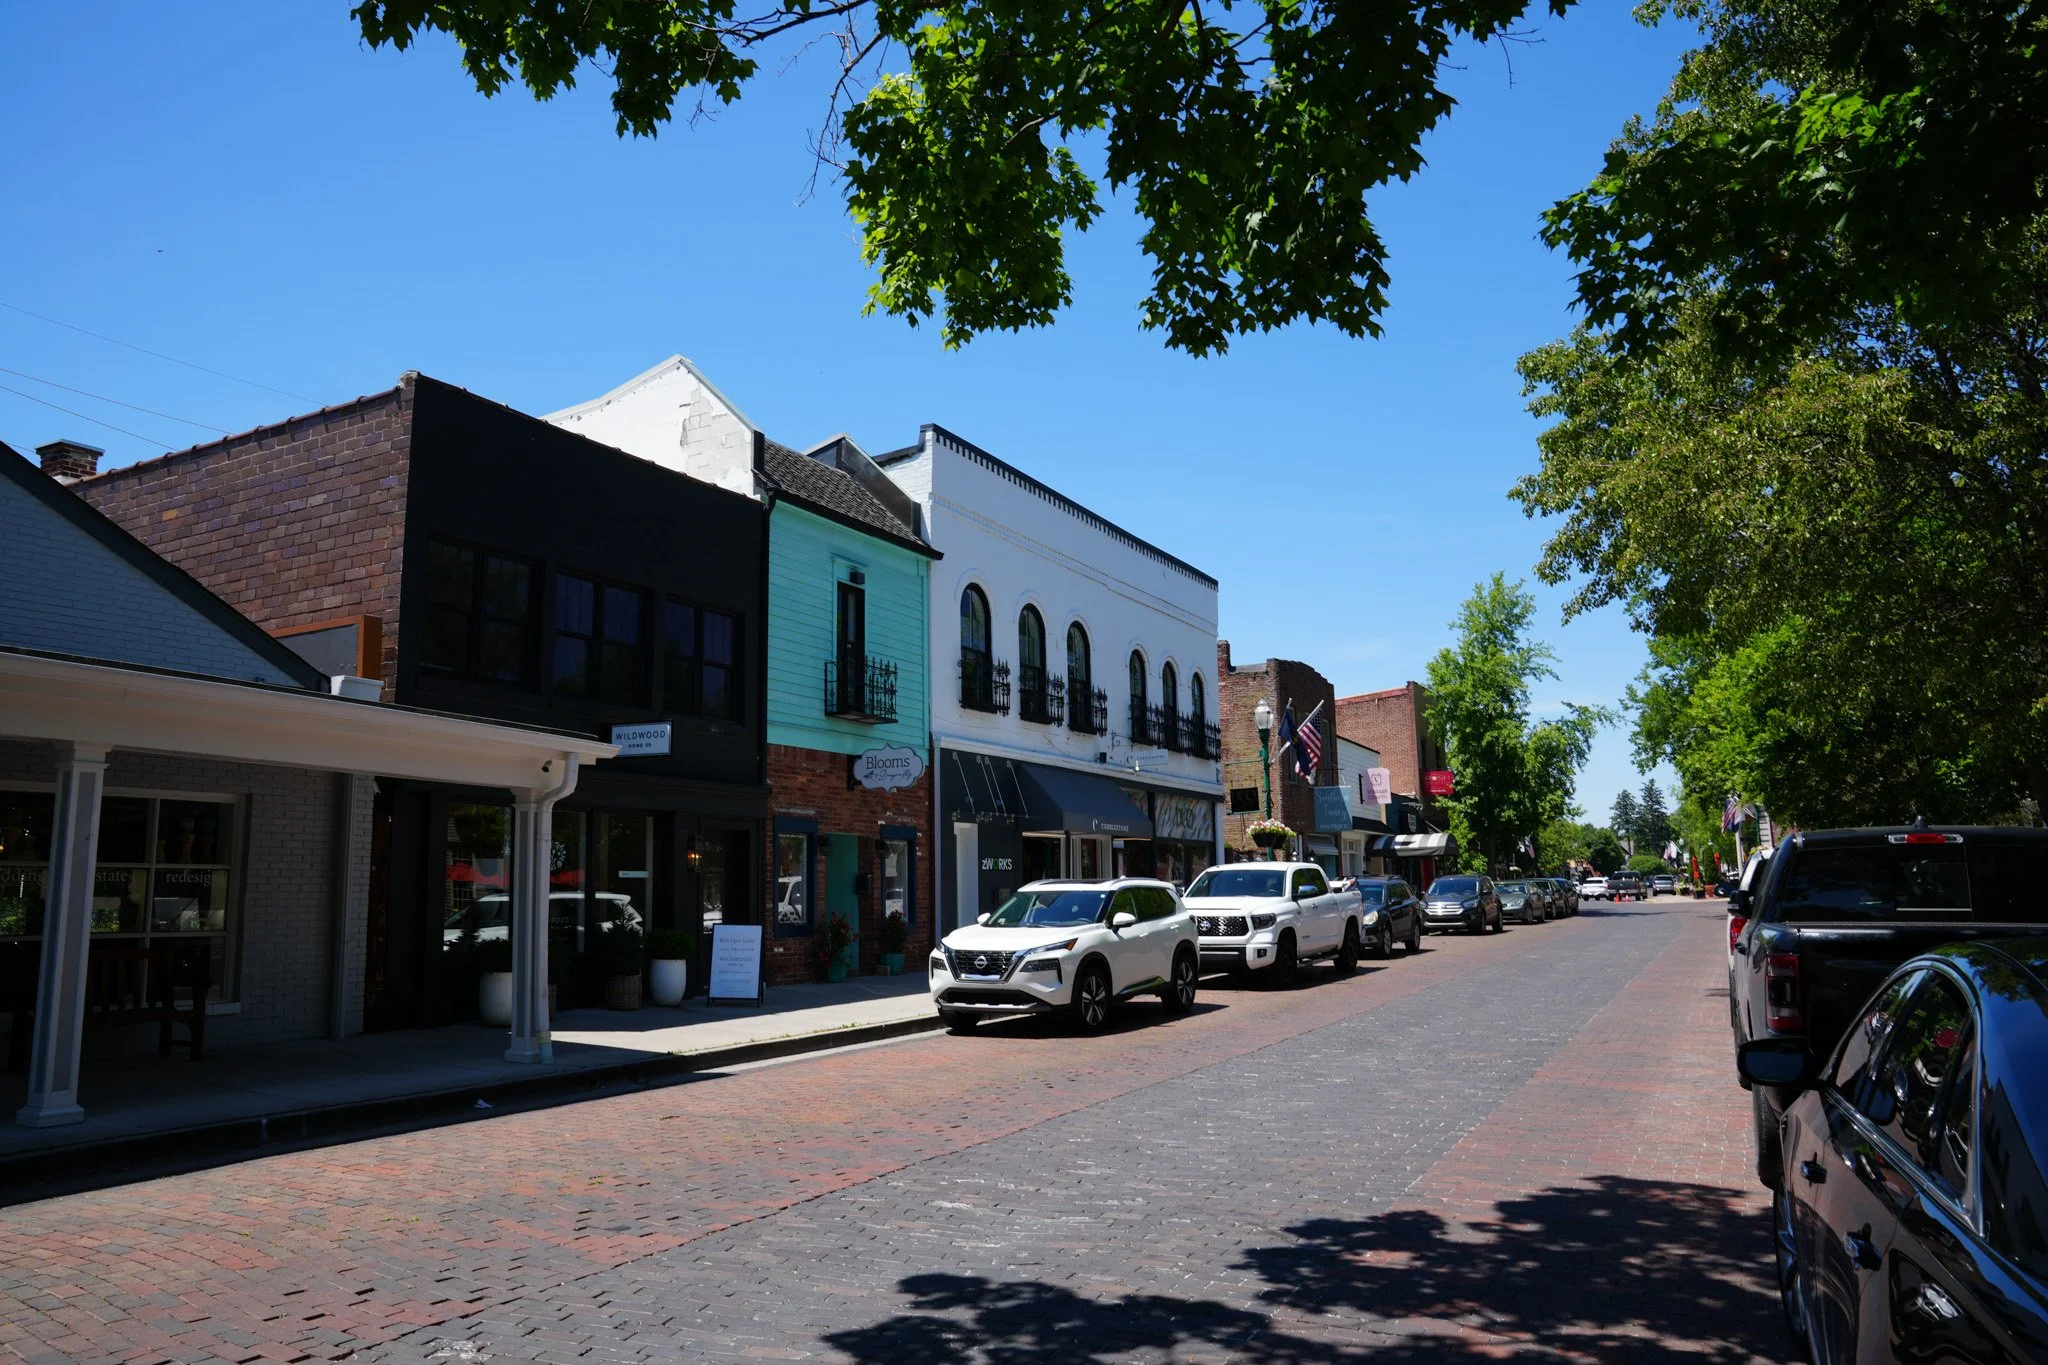
1
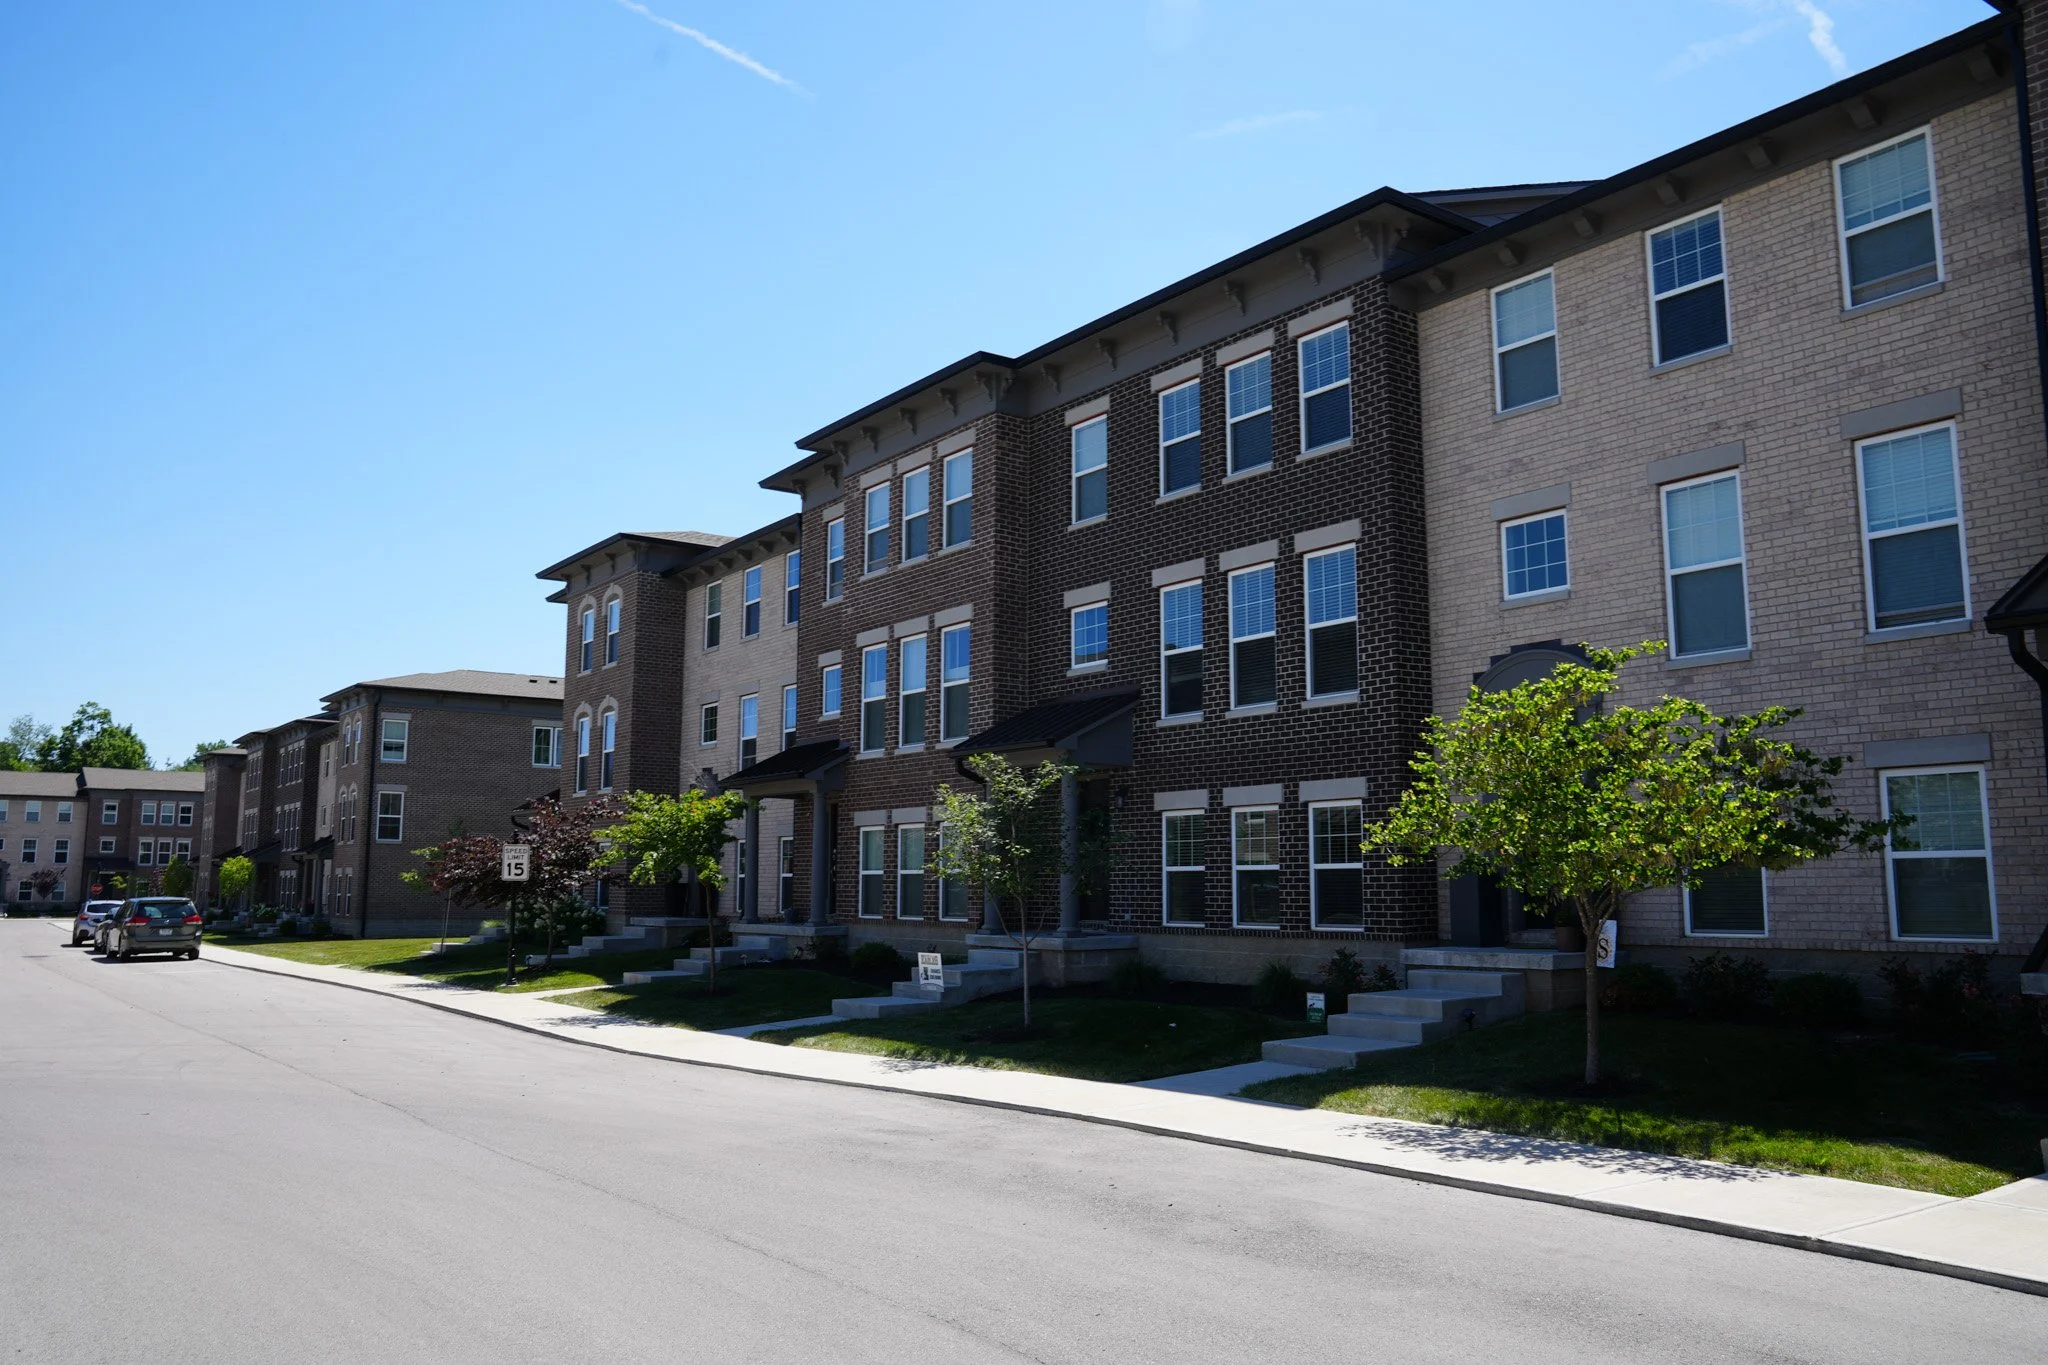
2
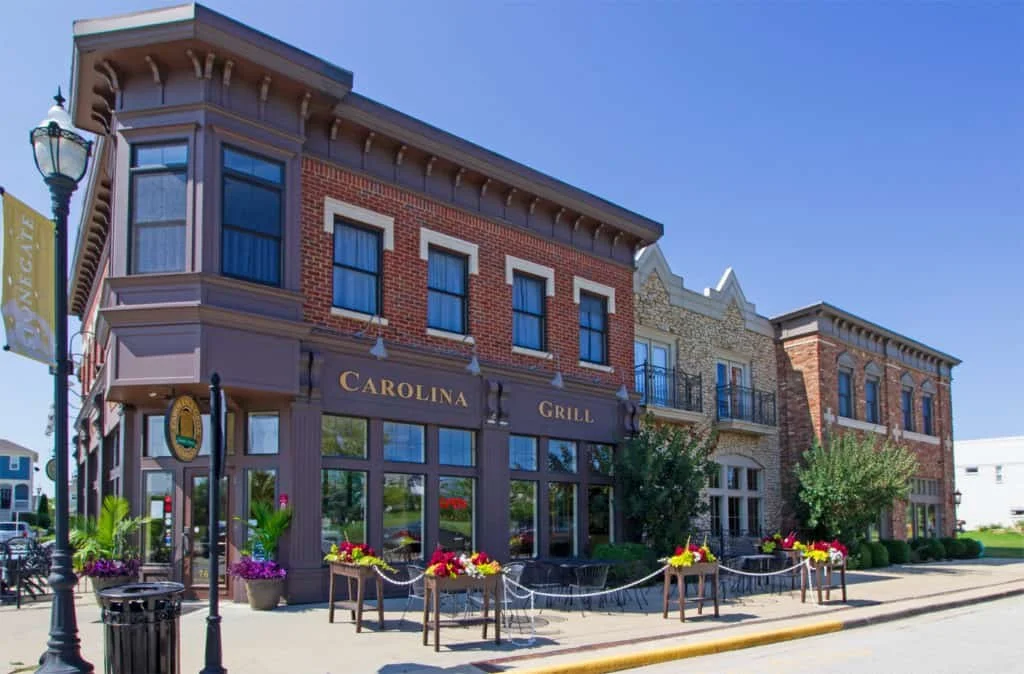
4

6

8
These styles of development help generate revenue to the Town in the form of more property taxes, and in many cases, increased sales taxes. These development patterns exude major design similarities to the Village, the heart and pride of Zionsville. With increasing demand to live in Zionsville, the Town must consider ways that it can accommodate growth in a fiscally responsible manor, as many residents desire growth only if it conforms to the existing Town Character and scale.
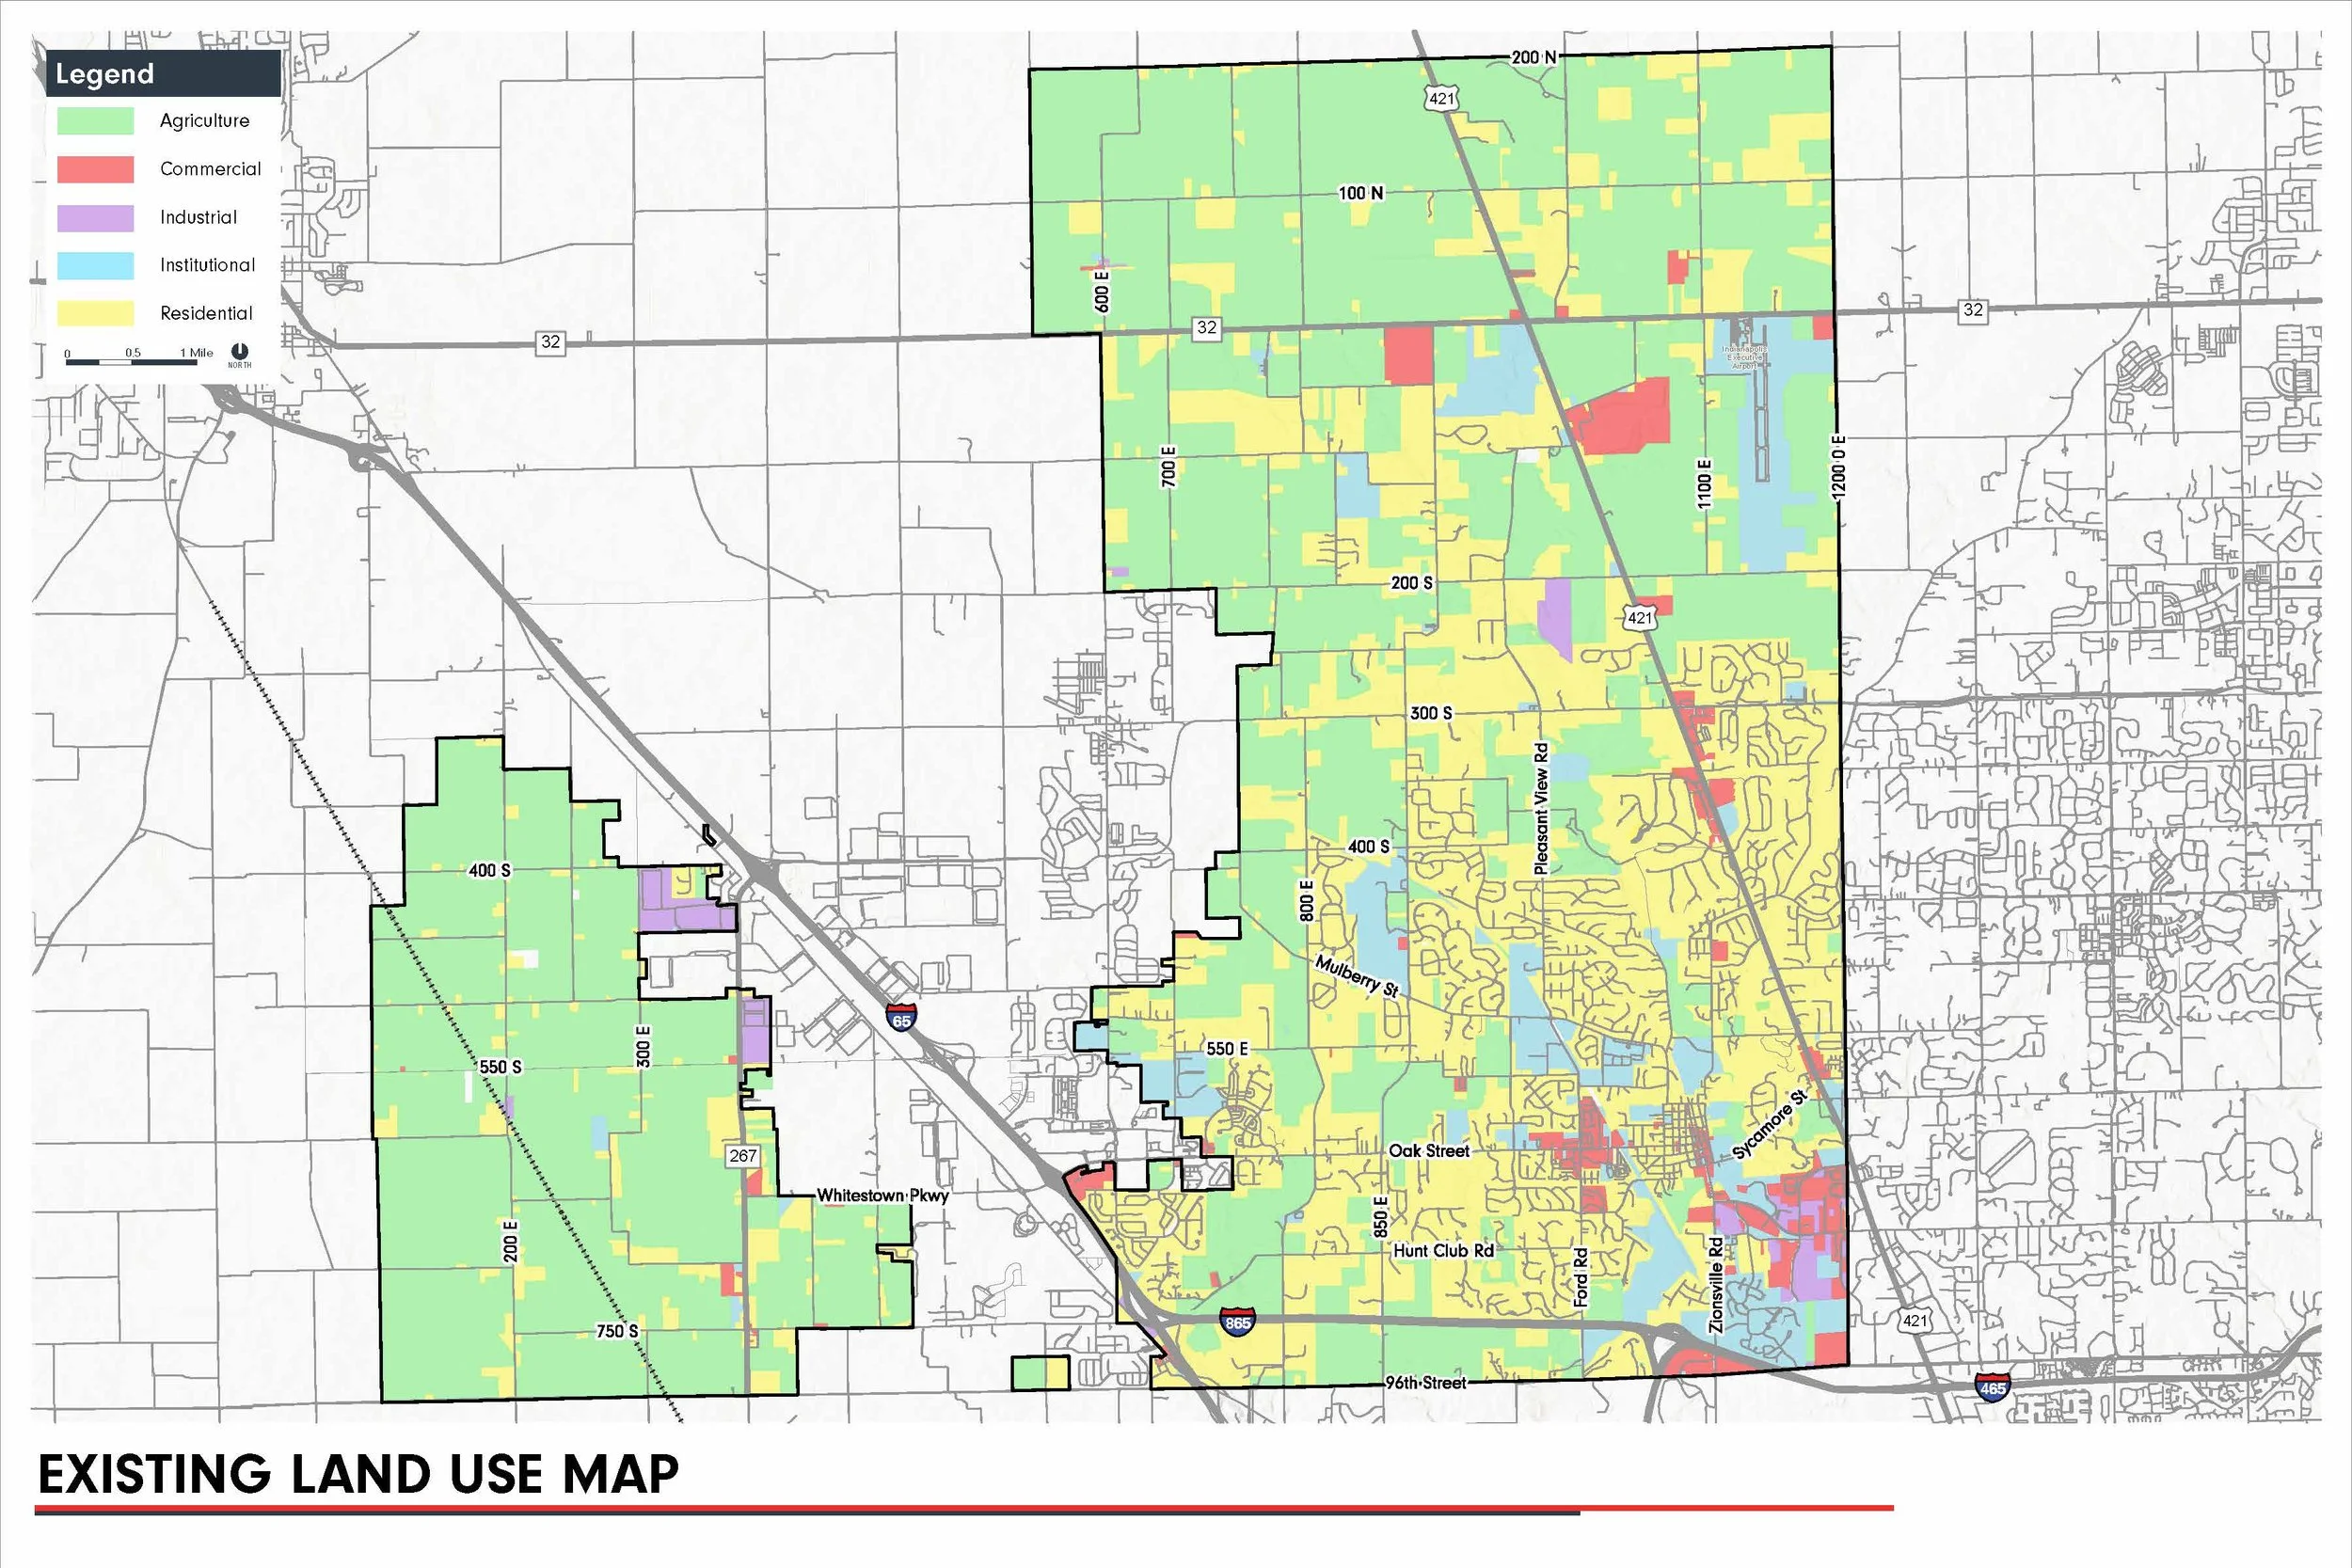
Zionsville’s Unique Land Use
The map below shows how land is used in all 66 square miles of the Town. Over half is used for agriculture, with nearly a quarter used for residential purposes. Institutional uses comprise roughly 15%, and commercial and industrial lands comprise less than 10%. The sheer volume of agricultural land in the Town is due to recent township mergers that incorporated three separate agricultural townships into the Town. Most residential land is in East Zionsville, surrounding the Village, and is mainly comprised of single-family-homes. The Town has a strikingly low percentage of commercial land, which puts high stress on the residential tax base. Many residents would like to see more commercial uses, partly to decrease property tax burden, while also having the convenience of closer commercial opportunities.