New Construction Building Permits
2013-2023
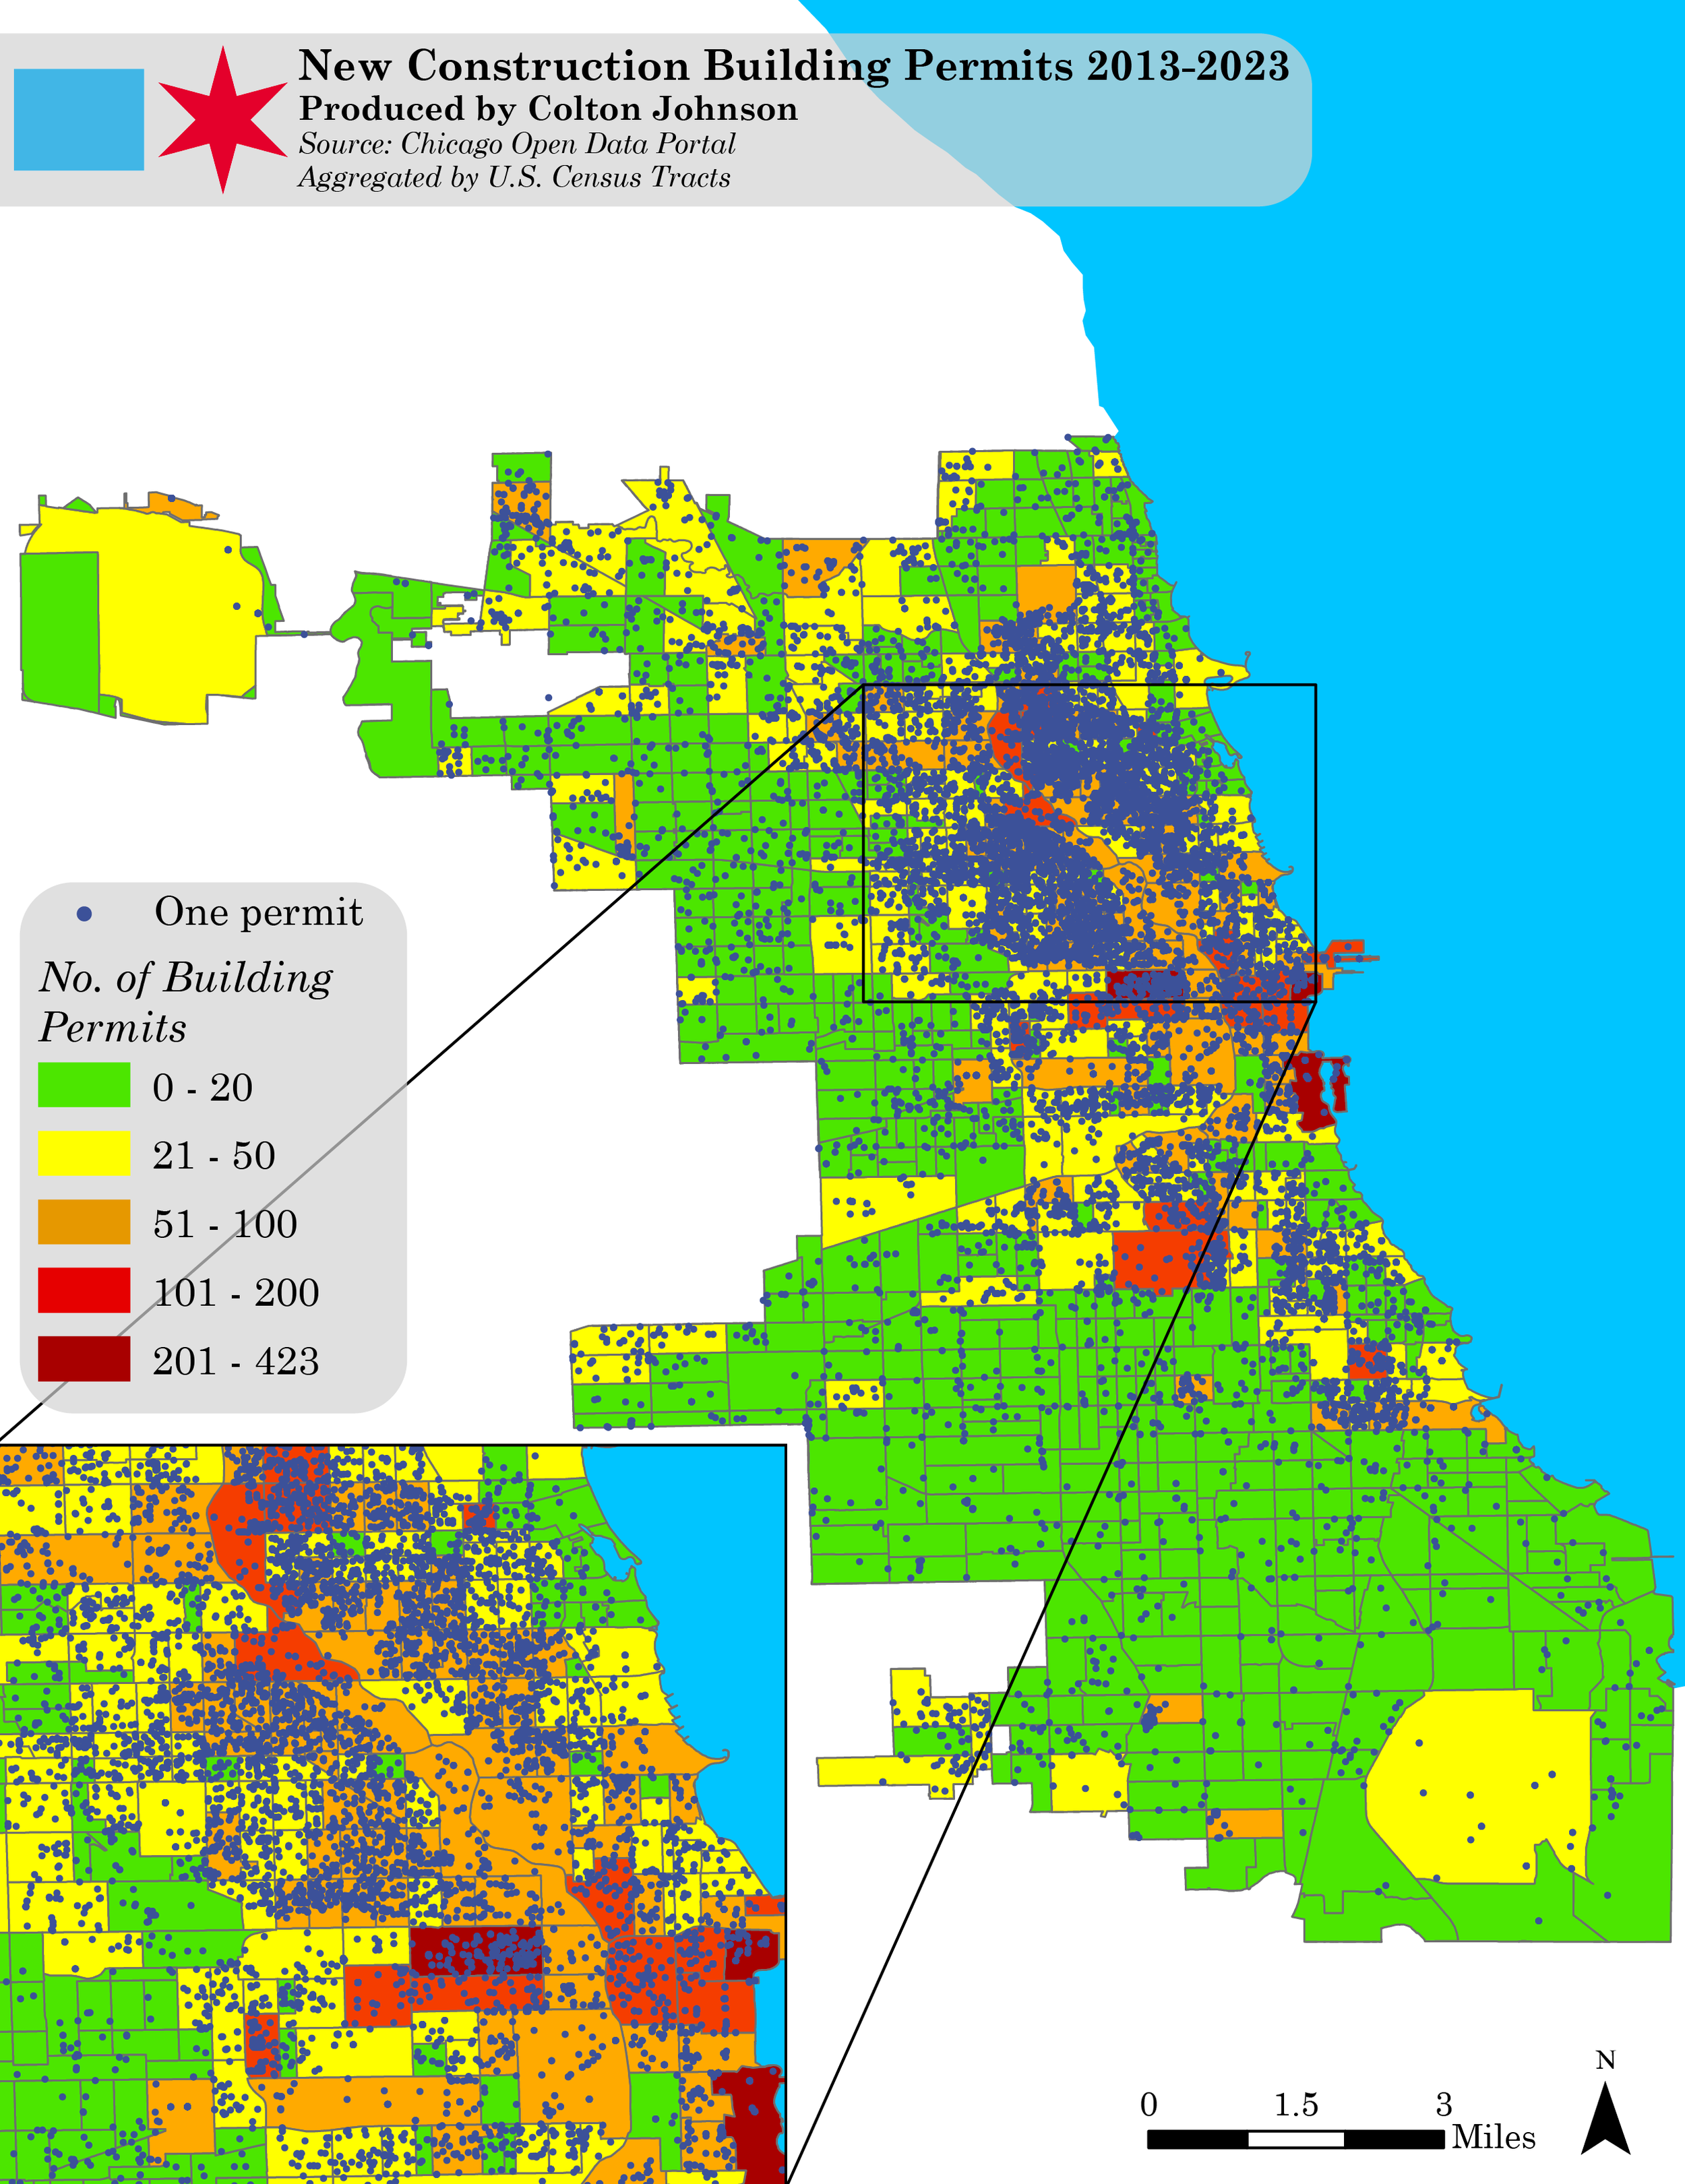
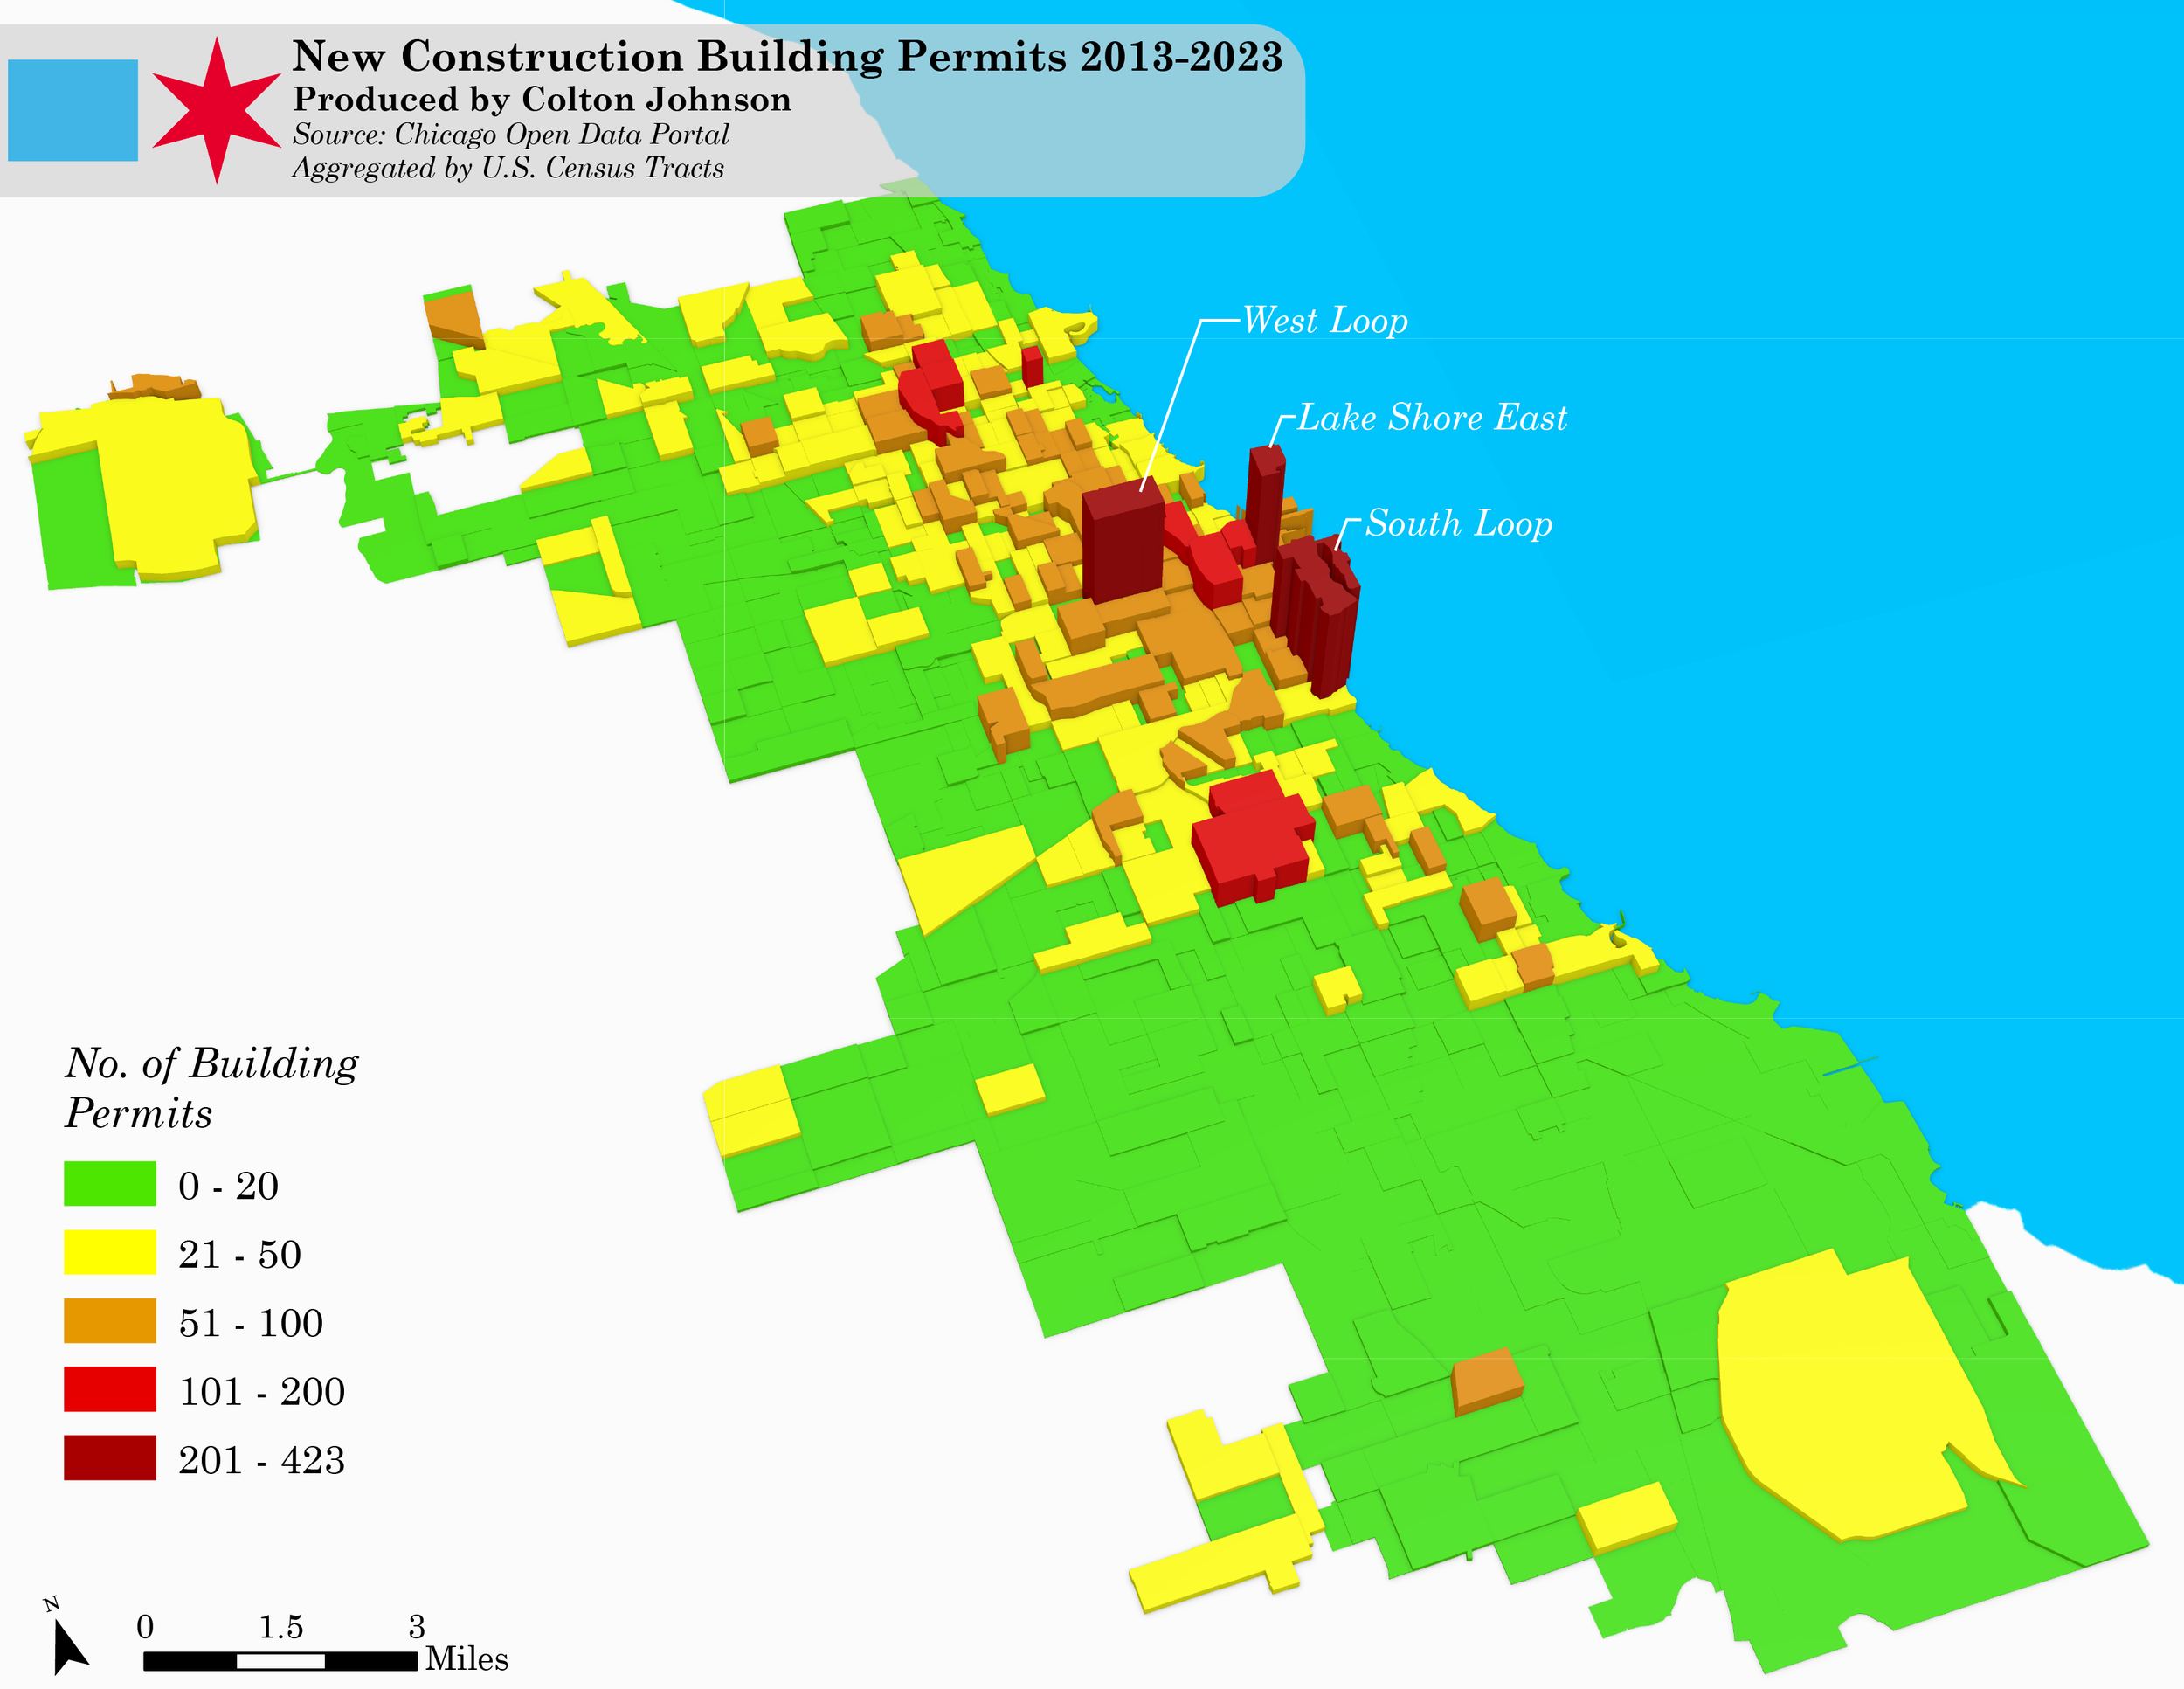
The map below visualizes a decade of new construction building permits (2013–2023) across Chicago’s census tracts, revealing stark disparities in development patterns. With over 16,000 permits issued for projects ranging from single-family homes to mixed-use midrises, the data highlights concentrated growth in areas like the Loop, West Loop, and Near North Side, regions synonymous with rapid investment and gentrification. In contrast, large swaths of the Far South, West, and Northwest Sides show markedly fewer permits, underscoring a persistent spatial inequity. Many of these underserved tracts are majority-minority and lower-income, raising critical questions about who benefits from urban development—and who gets left behind.
These disparities reflect deeper barriers: restrictive zoning, lack of financing for small-scale developers, and speculative land banking in disinvested areas. To address this, planners and policymakers must rethink traditional incentives. Could targeted tax abatements or streamlined permitting encourage reinvestment in marginalized neighborhoods? How might community land trusts or low-interest loan programs empower residents to lead redevelopment? Bridging this gap requires not only attracting outside investment but also dismantling obstacles that prevent local residents from shaping their own communities.